
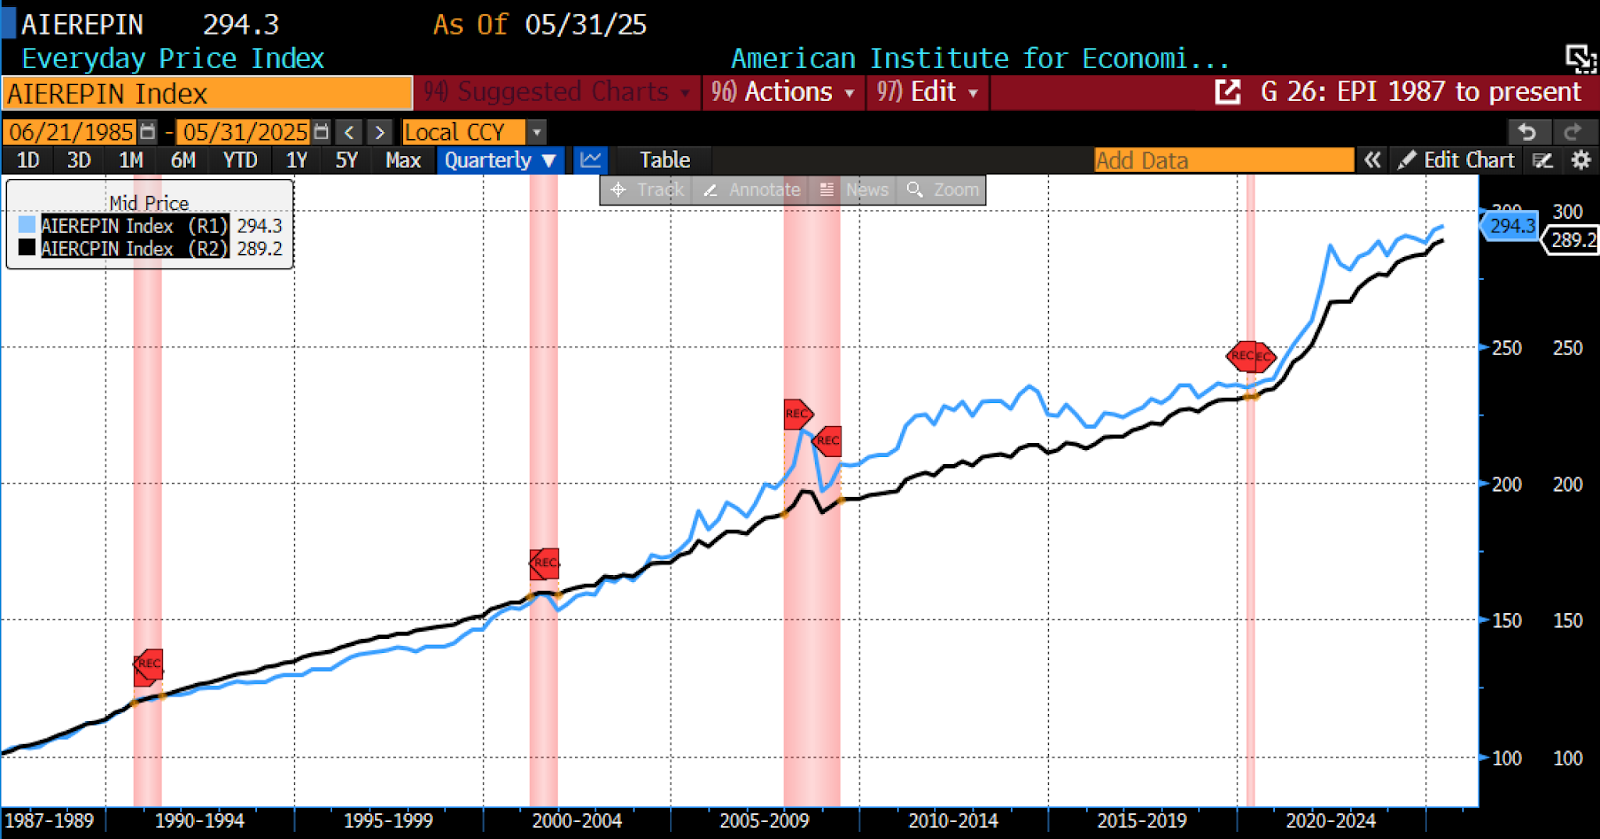
AIER’s Everyday Price Index (EPI) posted a 0.18 percent rise in May 2025, reaching 294.3. The index has now recorded six straight months of increases.
Of the twenty-four components making up the EPI, 13 recorded price increases from April to May, while two remained unchanged and nine declined. The most significant upward contributions came from recreational reading materials, tobacco and smoking products, and admissions to movies, theaters, and concerts. On the downside, the largest month-to-month decreases were observed in motor fuel, audio discs, tapes and other media, and intracity transportation services.
AIER Everyday Price Index vs. US Consumer Price Index (NSA, 1987 = 100)
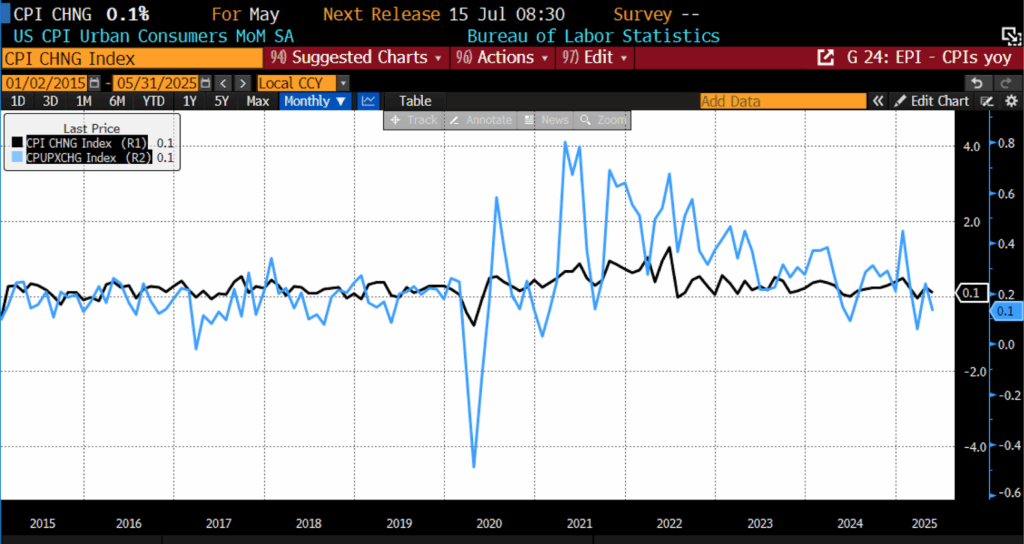
Also on June 11, 2025, the US Bureau of Labor Statistics (BLS) released its May 2025 Consumer Price Index (CPI) data. Both the month-to-month headline CPI and core month-to-month CPI number increased by 0.1 percent, less than the 0.3 percent increase forecast for core inflation and the 0.2 percent projected for the headline number.
May 2025 US CPI headline and core month-over-month (2015 – present)
In May 2025, the all-items Consumer Price Index rose 0.1 percent, driven primarily by a 0.3 percent increase in shelter costs. The food index advanced 0.3 percent, with both food at home and food away from home rising by the same amount. Within food at home, gains were led by cereals and bakery products (+1.1 percent), other food at home (+0.7 percent), and fruits and vegetables (+0.3 percent), while declines were seen in meats, poultry, fish, and eggs (-0.4 percent), nonalcoholic beverages (-0.3 percent), and dairy products (-0.1 percent). The energy index declined 1.0 percent, reflecting a 2.6 percent drop in gasoline prices and a 1.0 percent decrease in natural gas, partially offset by a 0.9 percent increase in electricity costs.
Excluding food and energy, the core index also rose 0.1 percent in May, following a 0.2 percent gain in April. Shelter continued to rise, with owners’ equivalent rent and rent of primary residence both up 0.3 percent, while lodging away from home edged down 0.1 percent. Medical care increased 0.3 percent, supported by hospital services (+0.4 percent) and prescription drugs (+0.6 percent), though physicians’ services fell 0.3 percent. Additional increases were observed in motor vehicle insurance (+0.7 percent), household furnishings (+0.3 percent), personal care (+0.5 percent), and education (+0.3 percent). Offsetting these gains were declines in airline fares (-2.7 percent), used cars and trucks (-0.5 percent), new vehicles (-0.3 percent), and apparel (-0.4 percent).
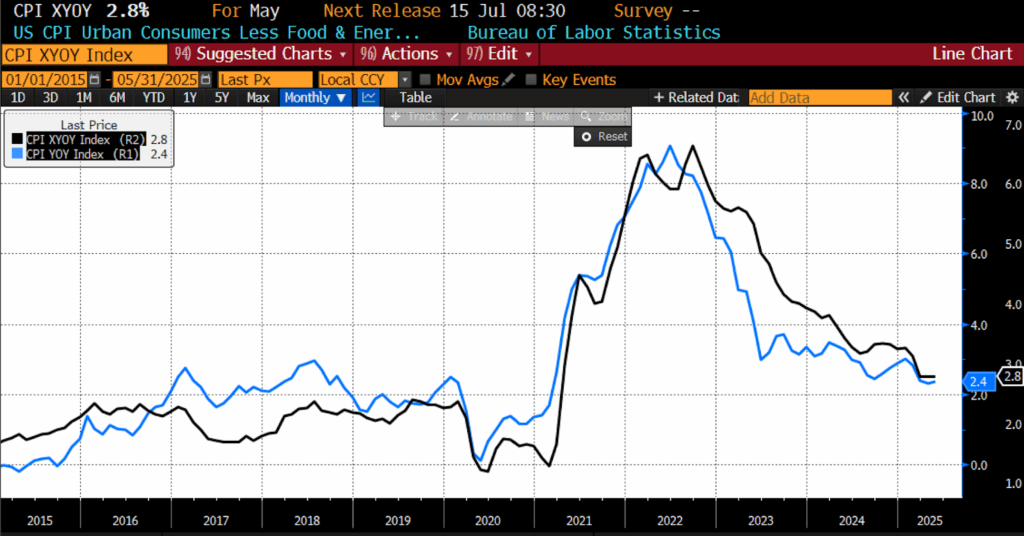
For the 12 months ending in May 2025, the headline Consumer Price Index increased 2.4 percent, meeting the consensus forecast. The core CPI year-over-year rose 2.8 percent, lower than the 2.9 percent forecast.
May 2025 US CPI headline and core year-over-year (2015 – present)
Over the last year food prices advanced 2.9 percent, with food at home rising 2.2 percent and food away from home up 3.8 percent. Within food at home, the largest increases were in meats, poultry, fish, and eggs (+6.1 percent), driven heavily by a 41.5 percent surge in egg prices. Nonalcoholic beverages rose 3.1 percent, dairy products increased 1.7 percent, other food at home rose 1.4 percent, and cereals and bakery products edged up 1.0 percent, while fruits and vegetables declined 0.5 percent over the year. The energy index fell 3.5 percent year-over-year, with gasoline down 12.0 percent and fuel oil down 8.6 percent, offset in part by increases in natural gas (+15.3 percent) and electricity (+4.5 percent).
Excluding food and energy, the core CPI rose 2.8 percent over the past 12 months. Shelter costs advanced 3.9 percent year-over-year, remaining the largest contributor to core inflation. Other notable annual increases were seen in motor vehicle insurance (+7.0 percent), medical care (+2.5 percent), household furnishings and operations (+2.7 percent), and recreation (+1.8 percent).
US consumer inflation continued to moderate in May, with both headline and core measures undershooting expectations for the fourth consecutive month. Yet beneath the surface, inflation pressures are highly bifurcated. Evidence of tariff pass-through persists in categories heavily exposed to Chinese imports — including appliances, household equipment, toys, and certain electronics — but these gains were offset by widespread disinflation elsewhere. Durable goods prices remained weak, with both new and used car prices declining by 0.3 and 0.5 percent respectively. Services inflation decelerated to 0.2 percent, led by further declines in airfares and hotel rates, as consumer discretionary spending shows signs of softening amid growing income uncertainty. Diffusion measures reflect this divergence: while 41 percent of core categories saw price declines in May, the share of categories rising at an annualized pace above 4 percent climbed to 40 percent, underscoring a complex and uneven inflation backdrop.
Looking ahead, the disinflationary momentum raises the likelihood that the Federal Reserve will remain patient in the near term but face growing pressure to ease policy later this year. Market participants now assign a roughly 75 percent probability of a Fed rate cut by September, as softer inflation prints coincide with early signs of labor market cooling and still-elevated consumer price sensitivities. While temporary trade agreements between the US and China have eased some tariff-related price pressures, risks remain: additional tariff escalations could eventually feed through more forcefully into consumer prices, particularly if inventory buffers shrink. Firms including Walmart, Target, and major automakers have already signaled the likelihood of higher prices ahead. For now, however, the balance of risks continues to tilt toward a gradual disinflation narrative: one that leaves policymakers cautious but not yet compelled to act aggressively.