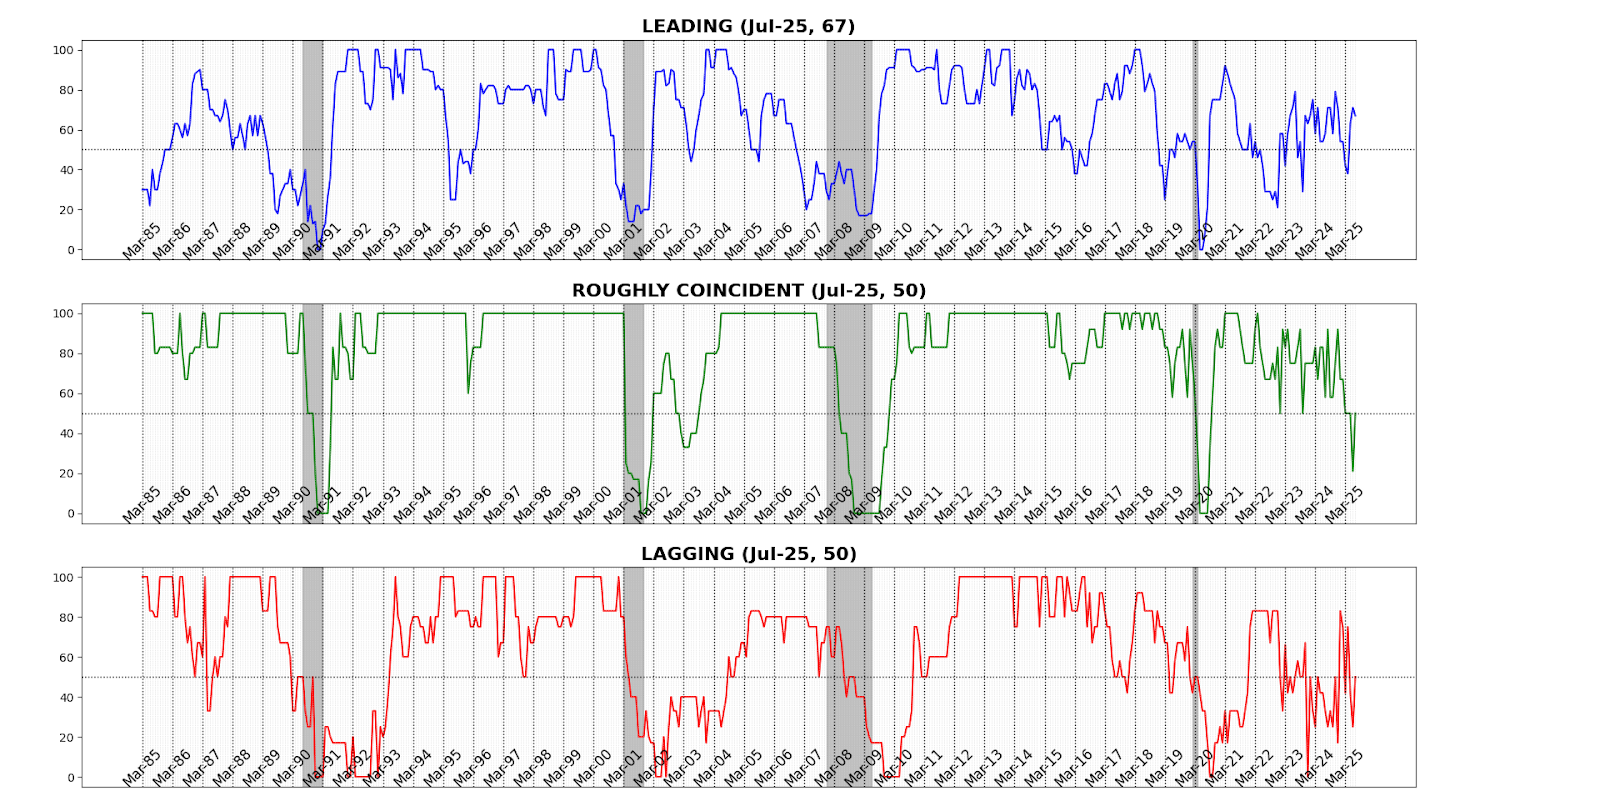
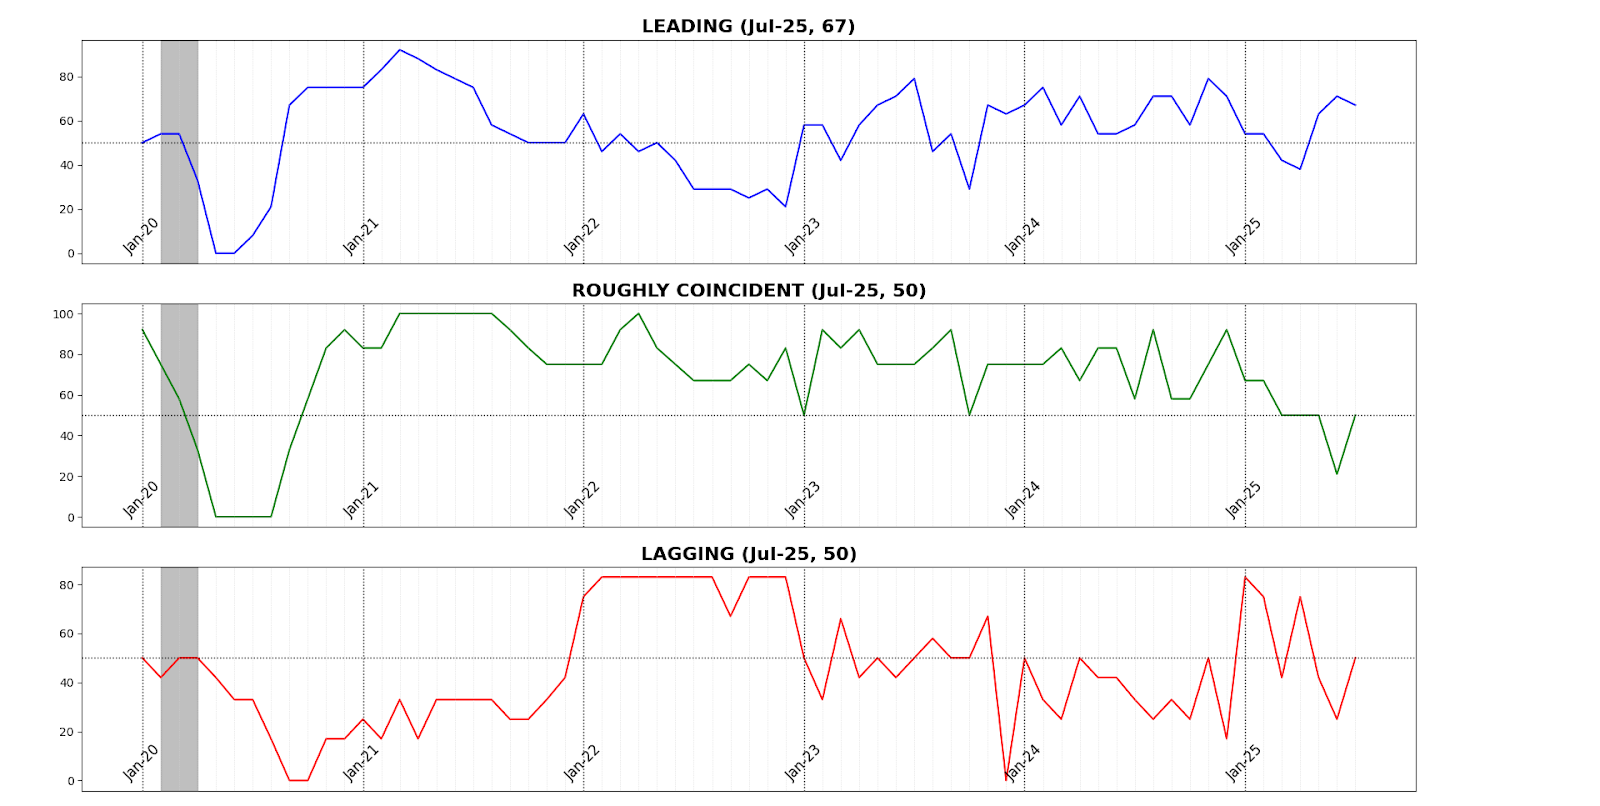
AIER’s Business Conditions Monthly indicators for July 2025 point to a reversal of last month’s momentum and a rebalancing across the indicator set. The Leading Indicator slipped 4 points to 67 from 71, ending the late spring surge and underscoring lingering fragility in certain forward-looking measures. Markets and housing remained supportive, but weaker sentiment and transport demand tempered breadth, suggesting that expectations for a strong second-half pickup should be moderated.
The Roughly Coincident Indicator rose from 21 to 50, marking a pause after June’s sharp contraction. Stability at this level reflects an offsetting mix of modest gains in sales, income, and payrolls against declines in production, participation, and sentiment — leaving the real-time picture flat but fragile.
The most notable change came in the Lagging Indicator, which leapt to 50 from 25, with inflation pressures and growth in loans driving the surge. While backward-looking data typically trail turns in the cycle, the sudden jump signals a reemergence of price and credit intensity even as leading measures ease. Taken together, July’s Business Conditions profile points to softer forward momentum, stalled current activity, and backward indicators solidifying — a configuration that keeps the near-term outlook unsettled and highlights the difficulty of extrapolating clear directional signals in a period of policy volatility.
LEADING INDICATOR (67)
The Leading Indicator eased to 67 in July from June’s level of 71, with seven of twelve components improving, one unchanged, and four declining.
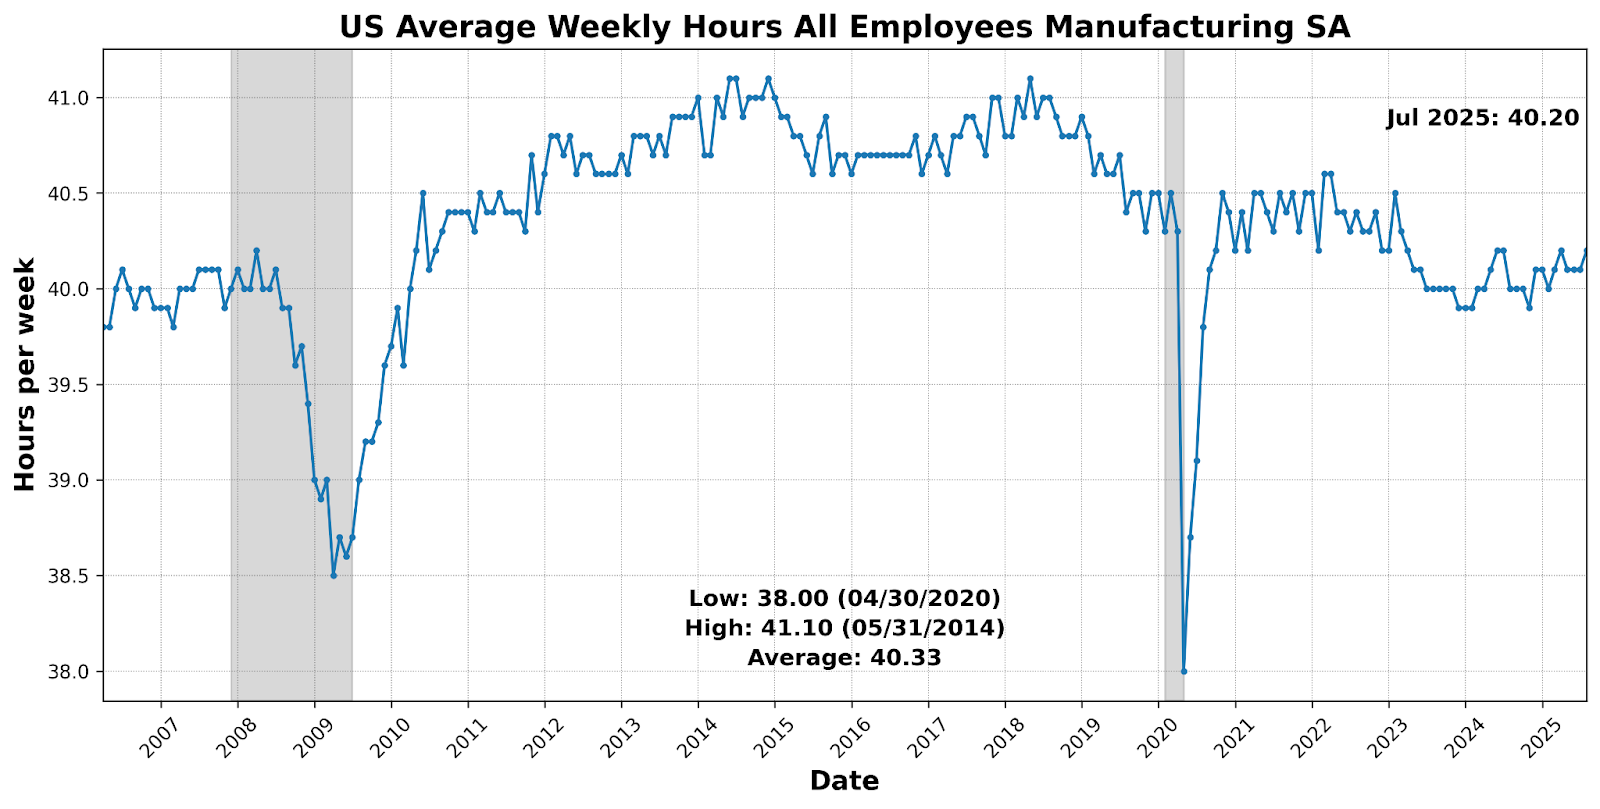
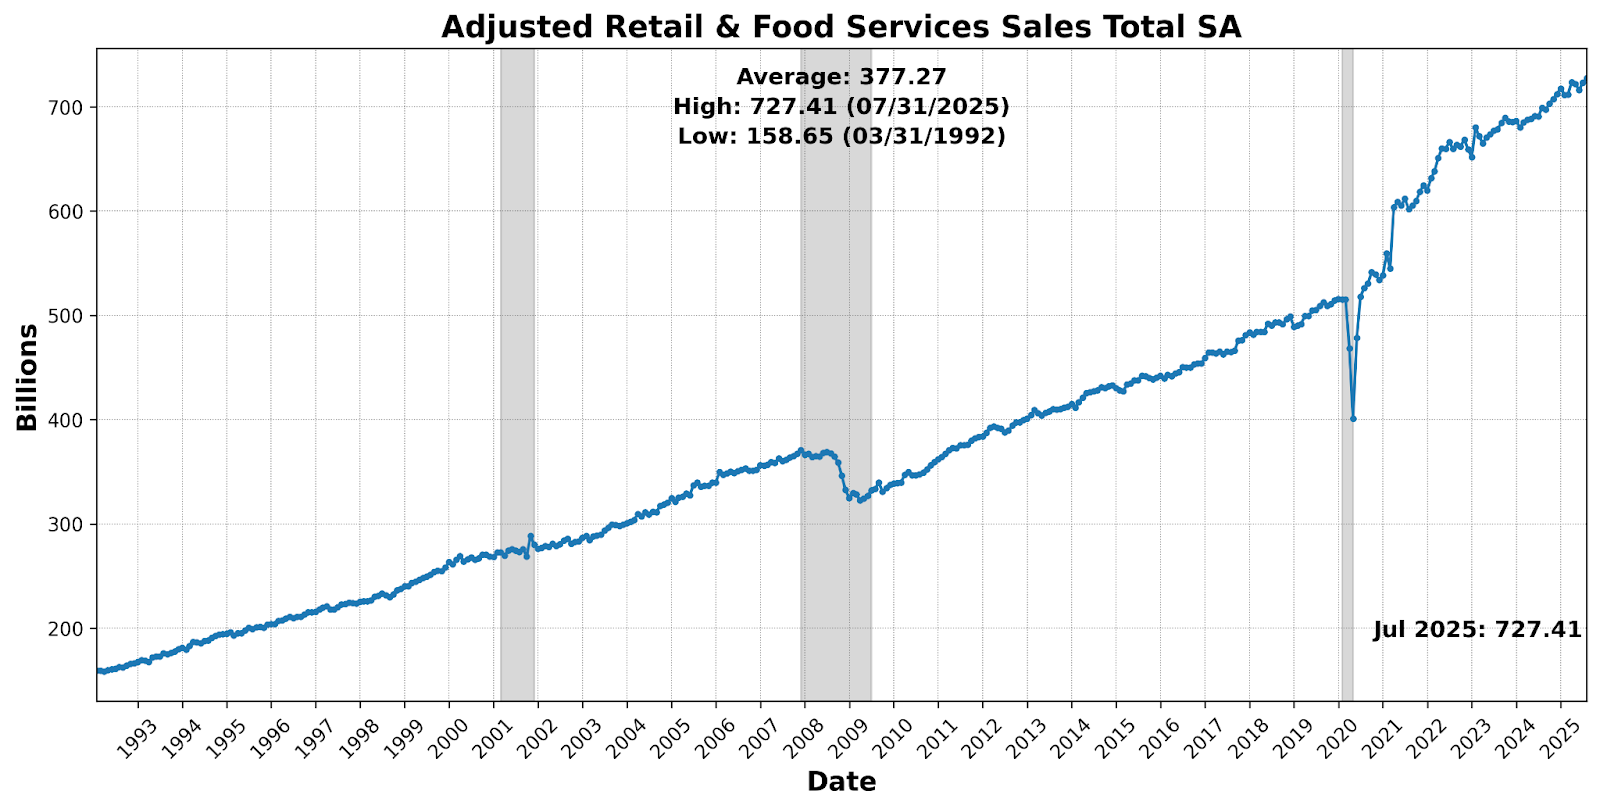
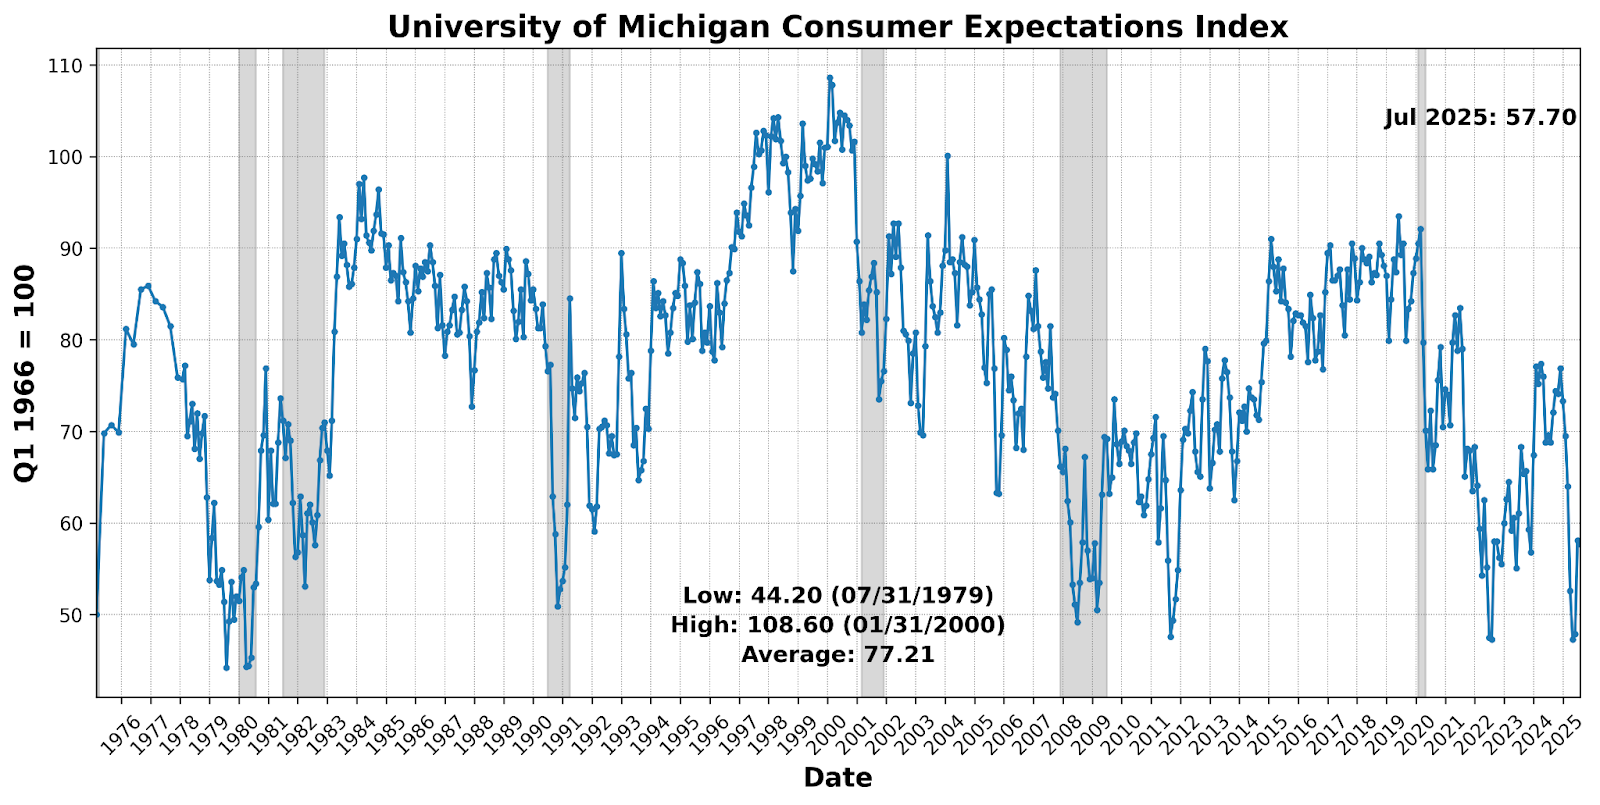
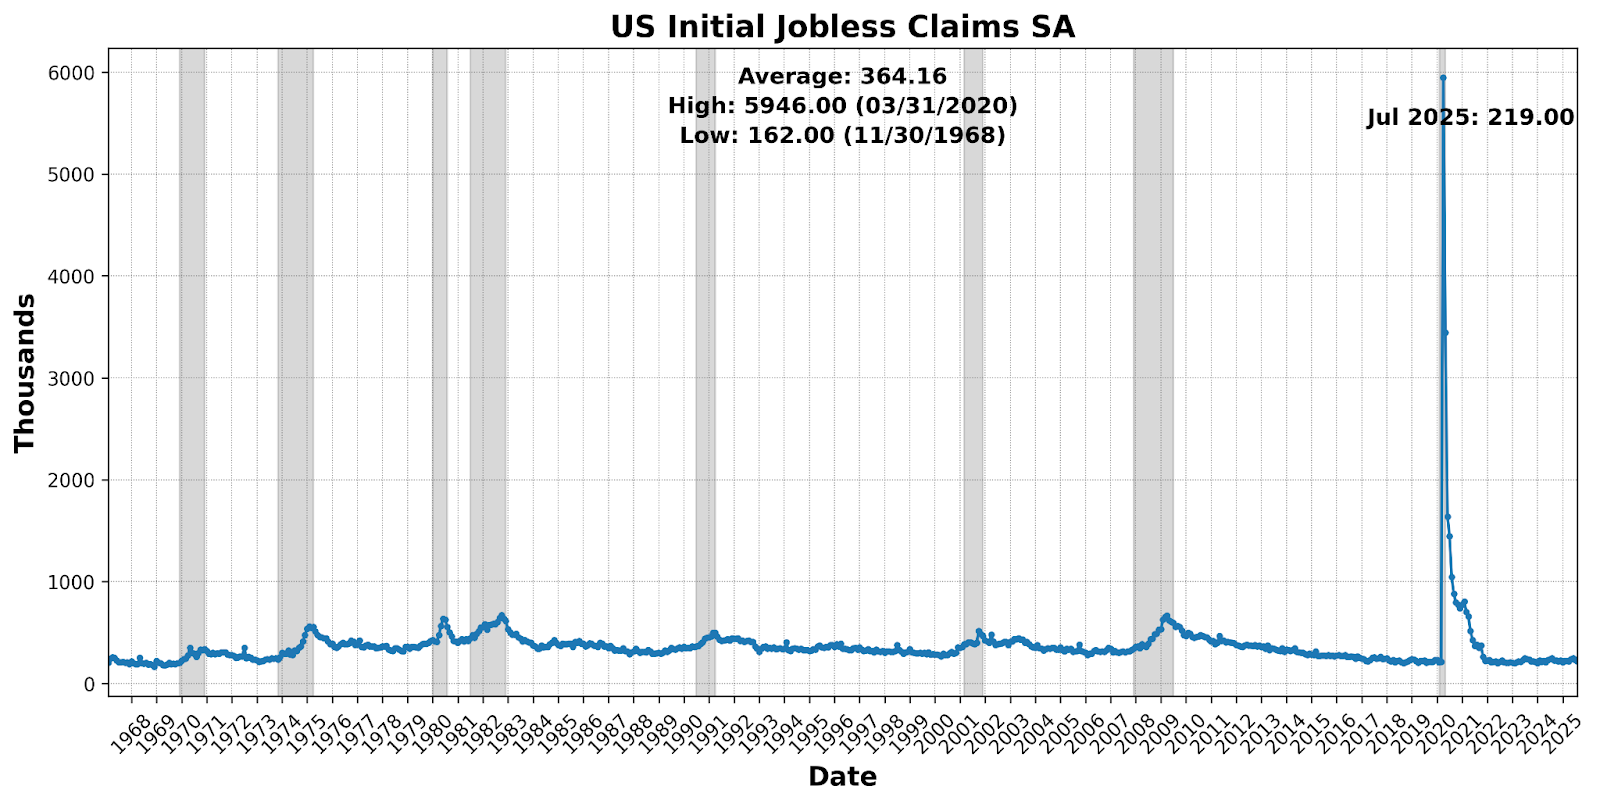
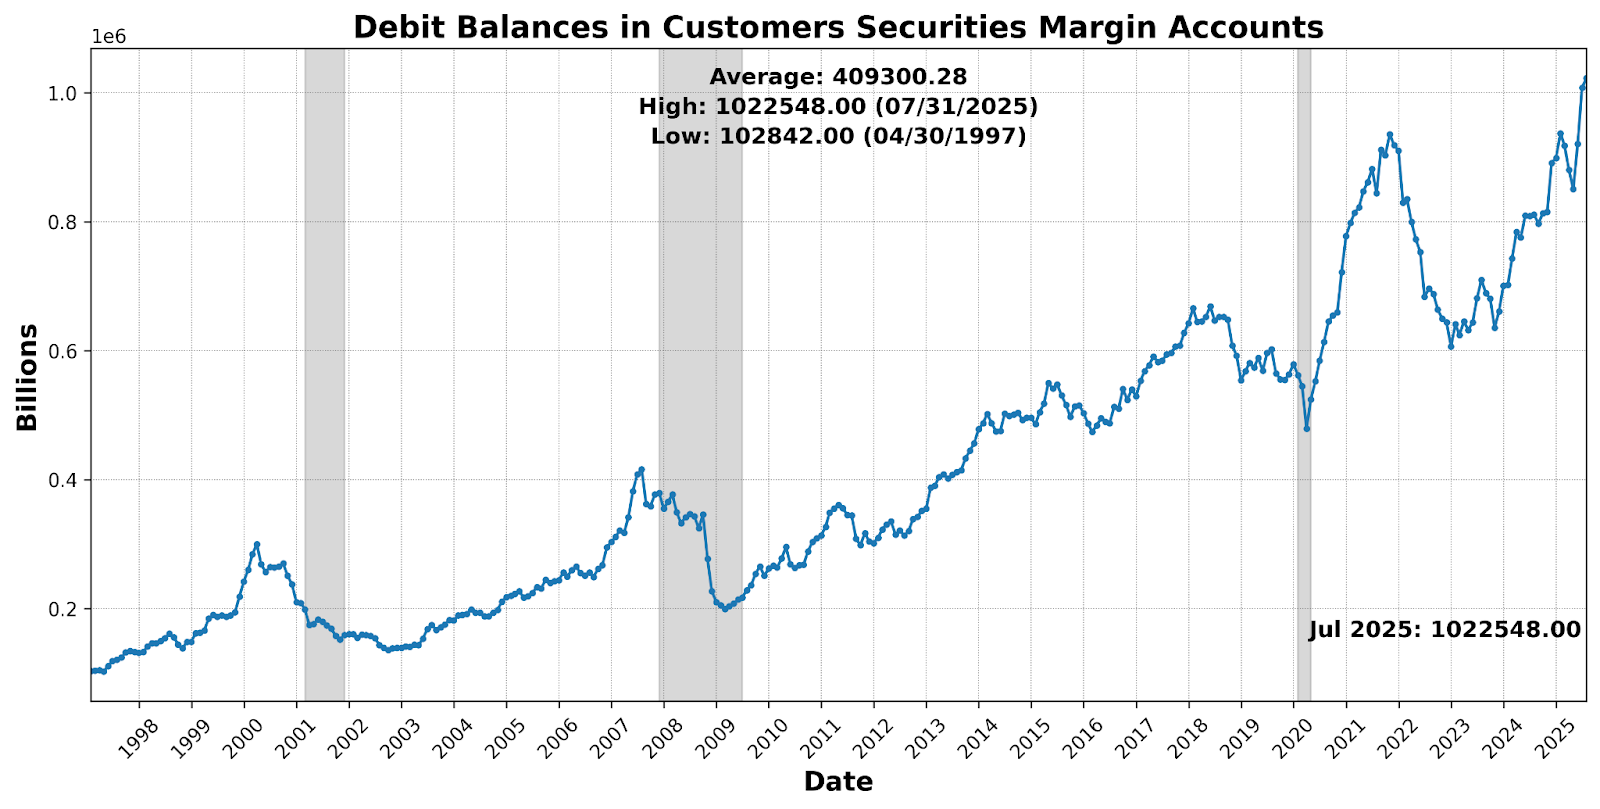
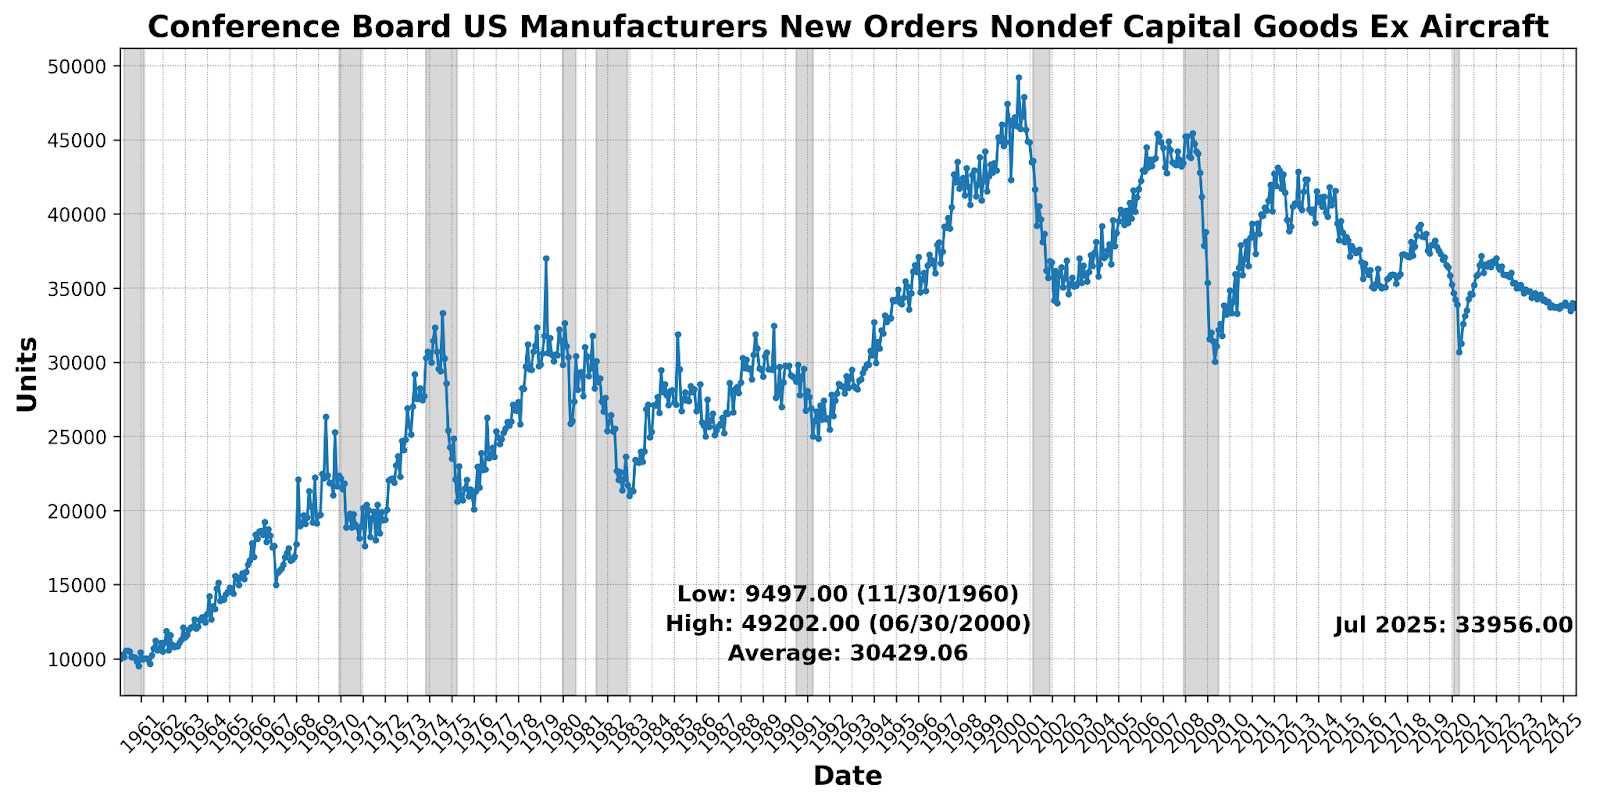
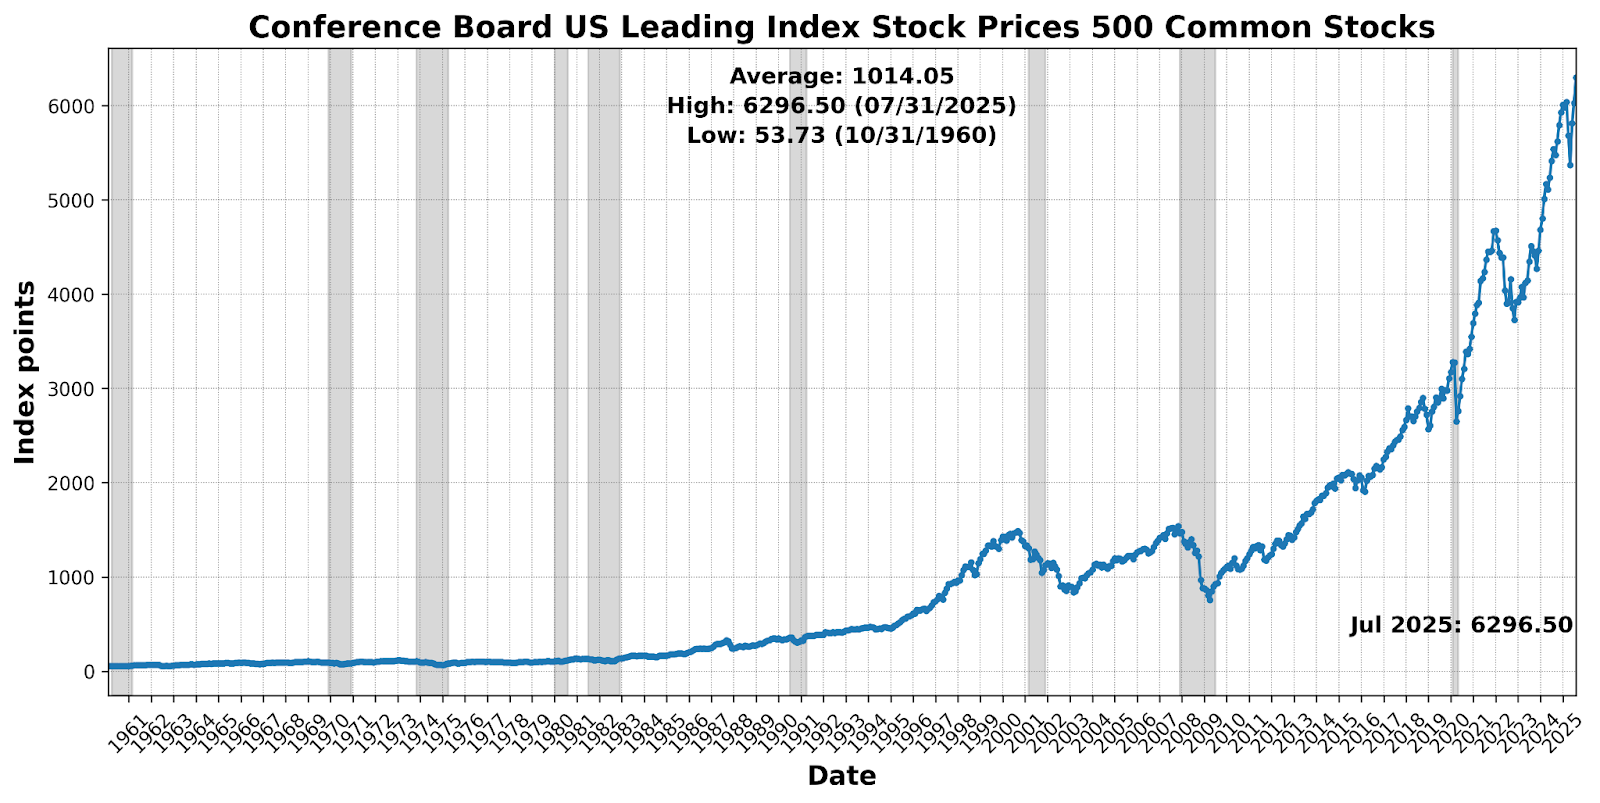
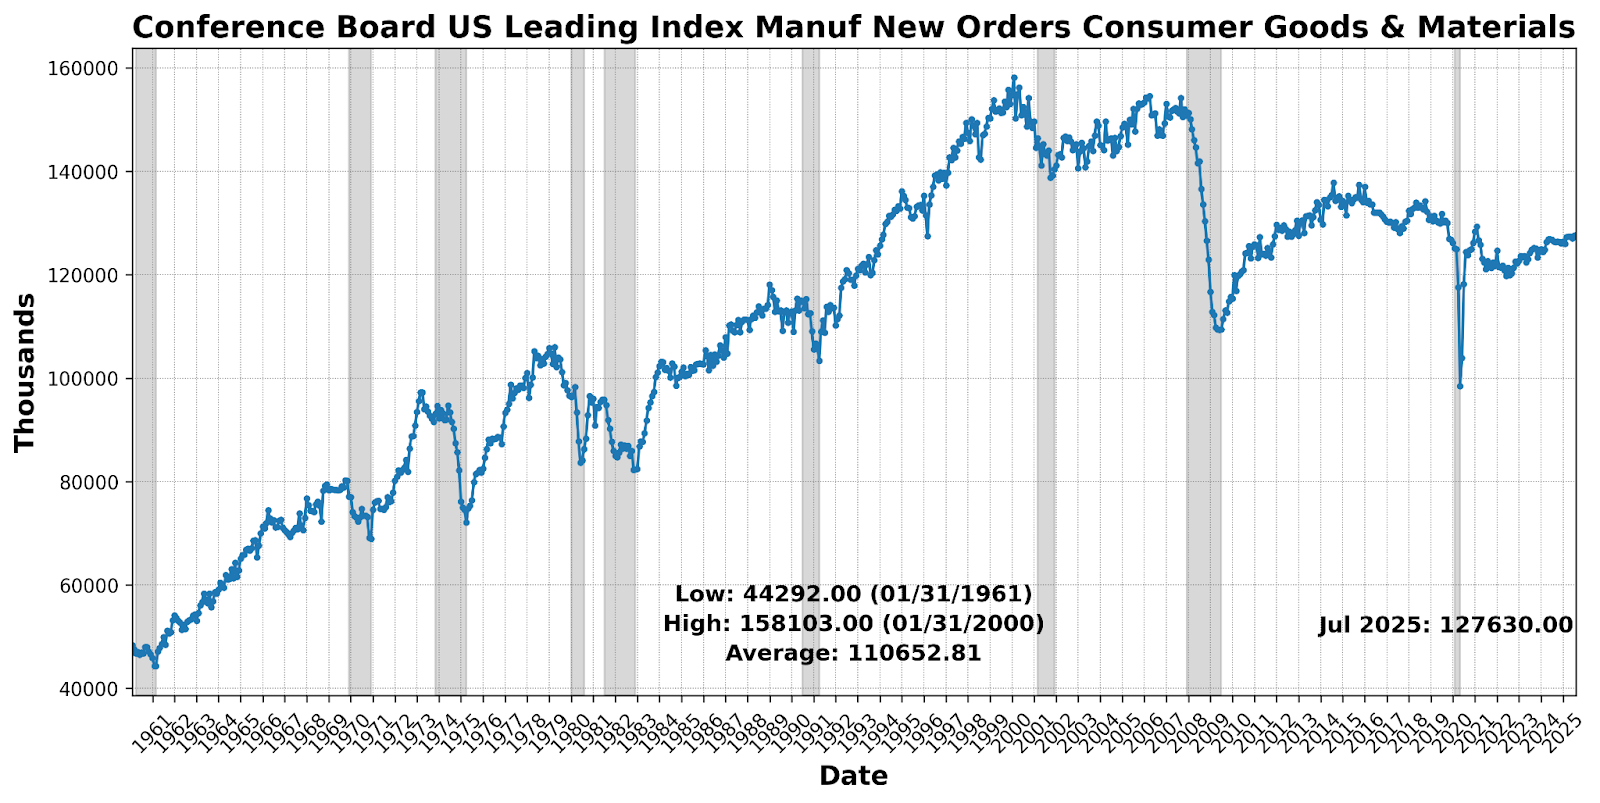
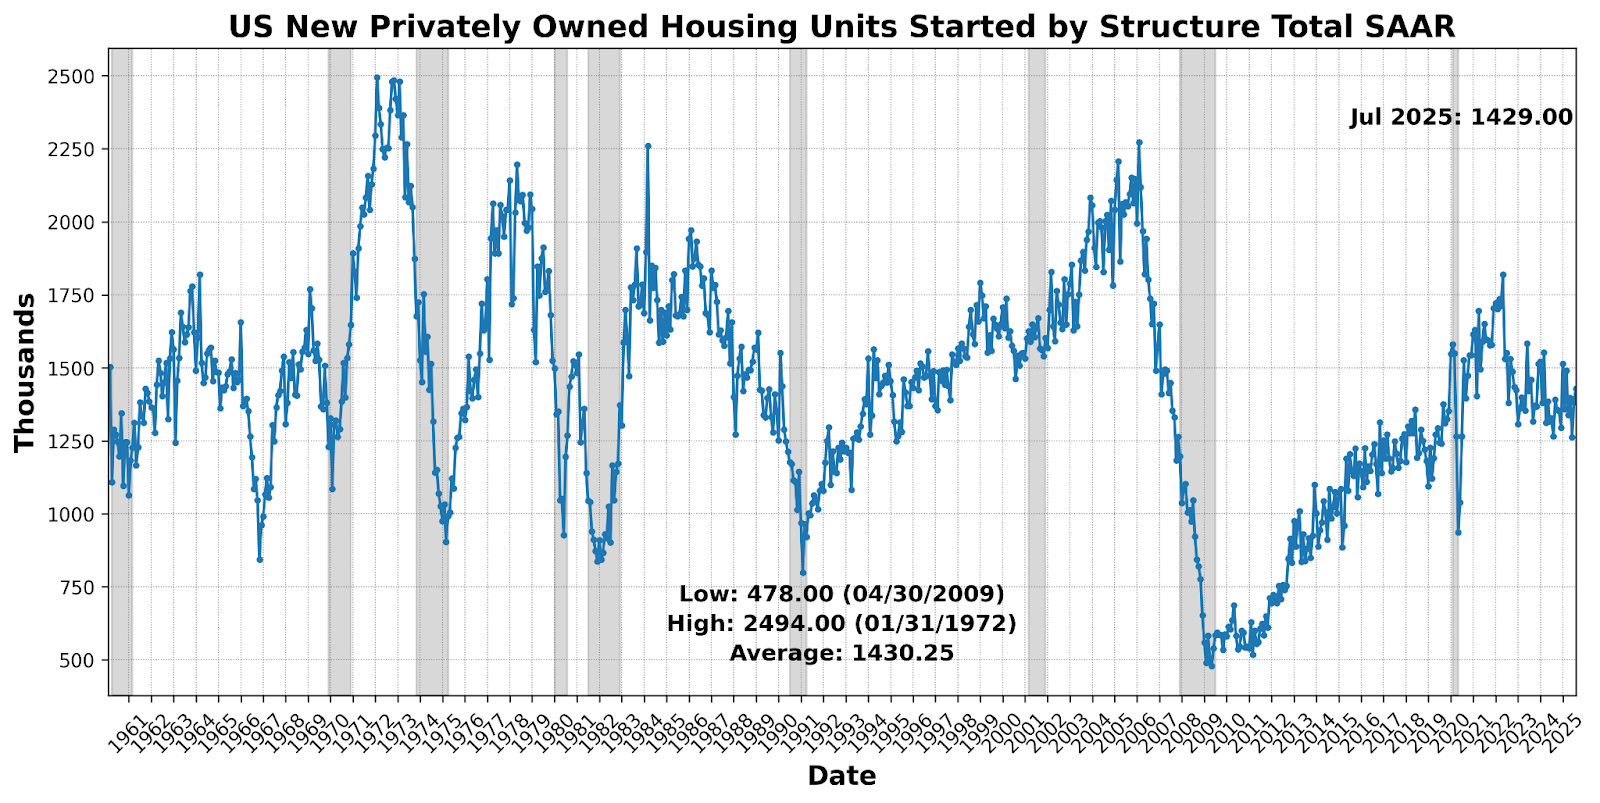
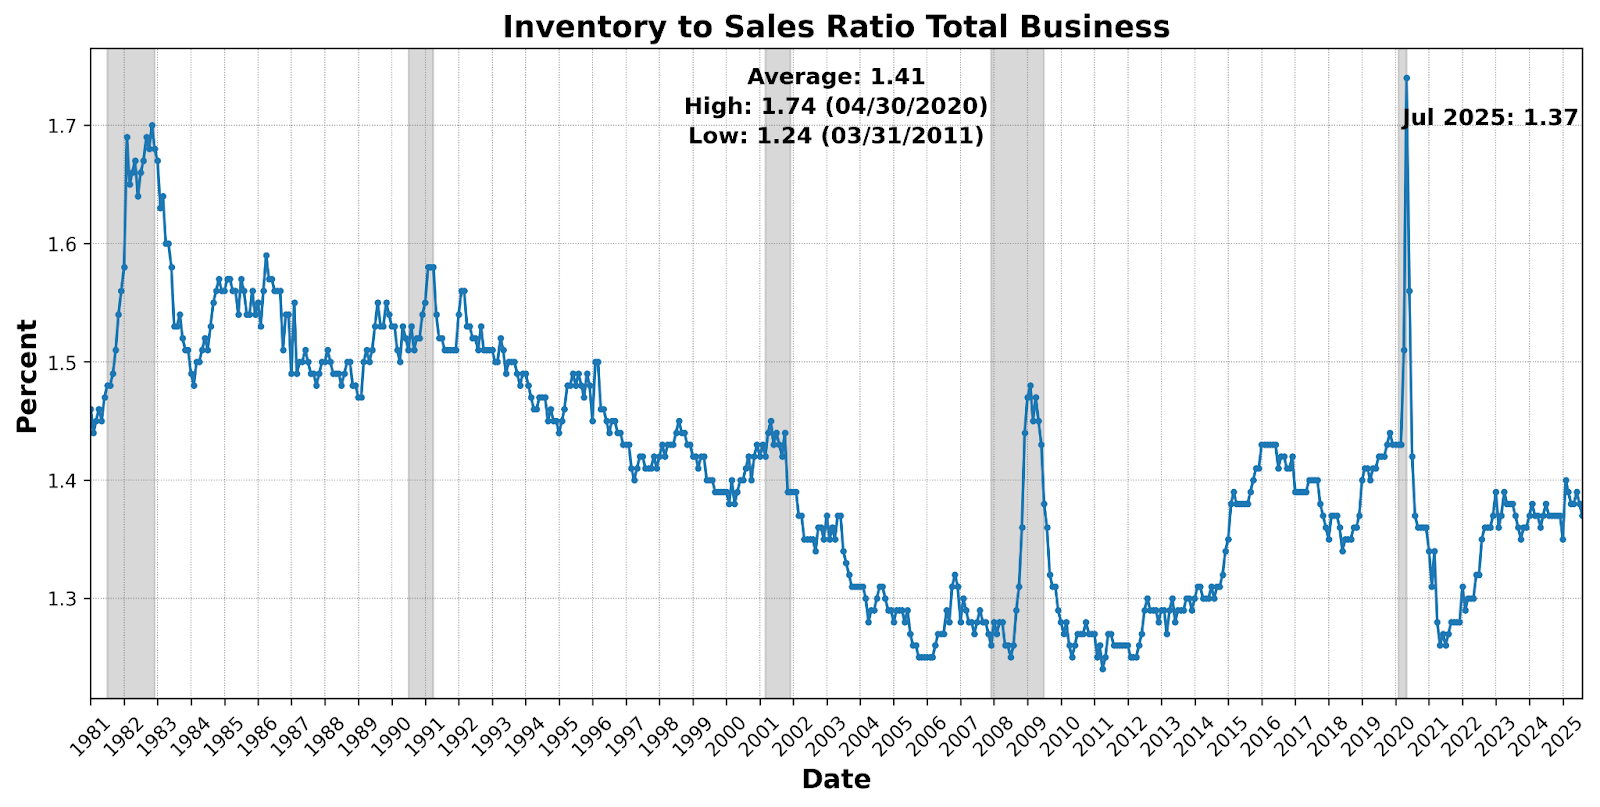
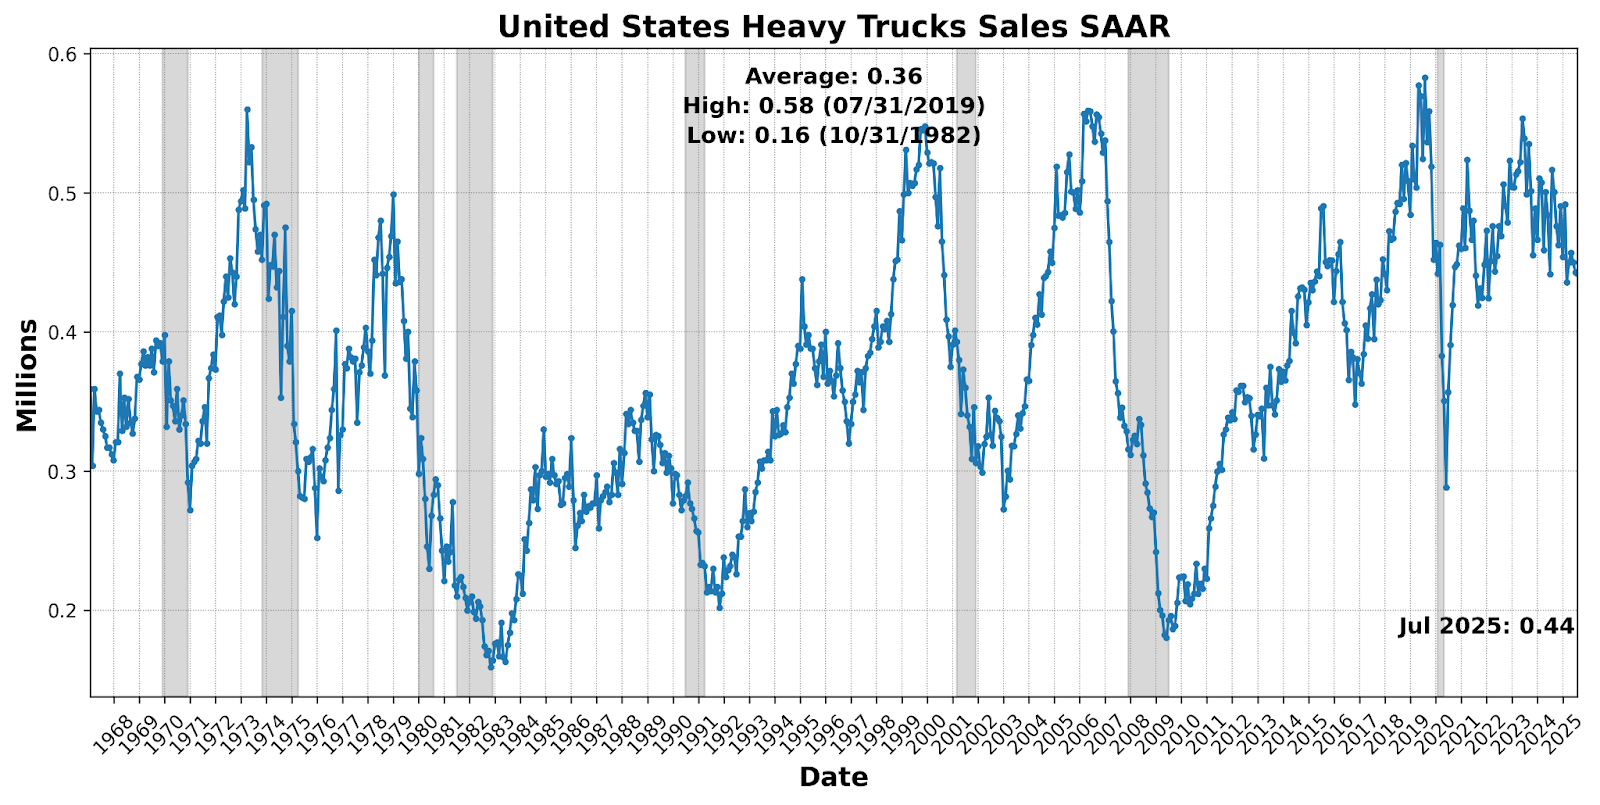
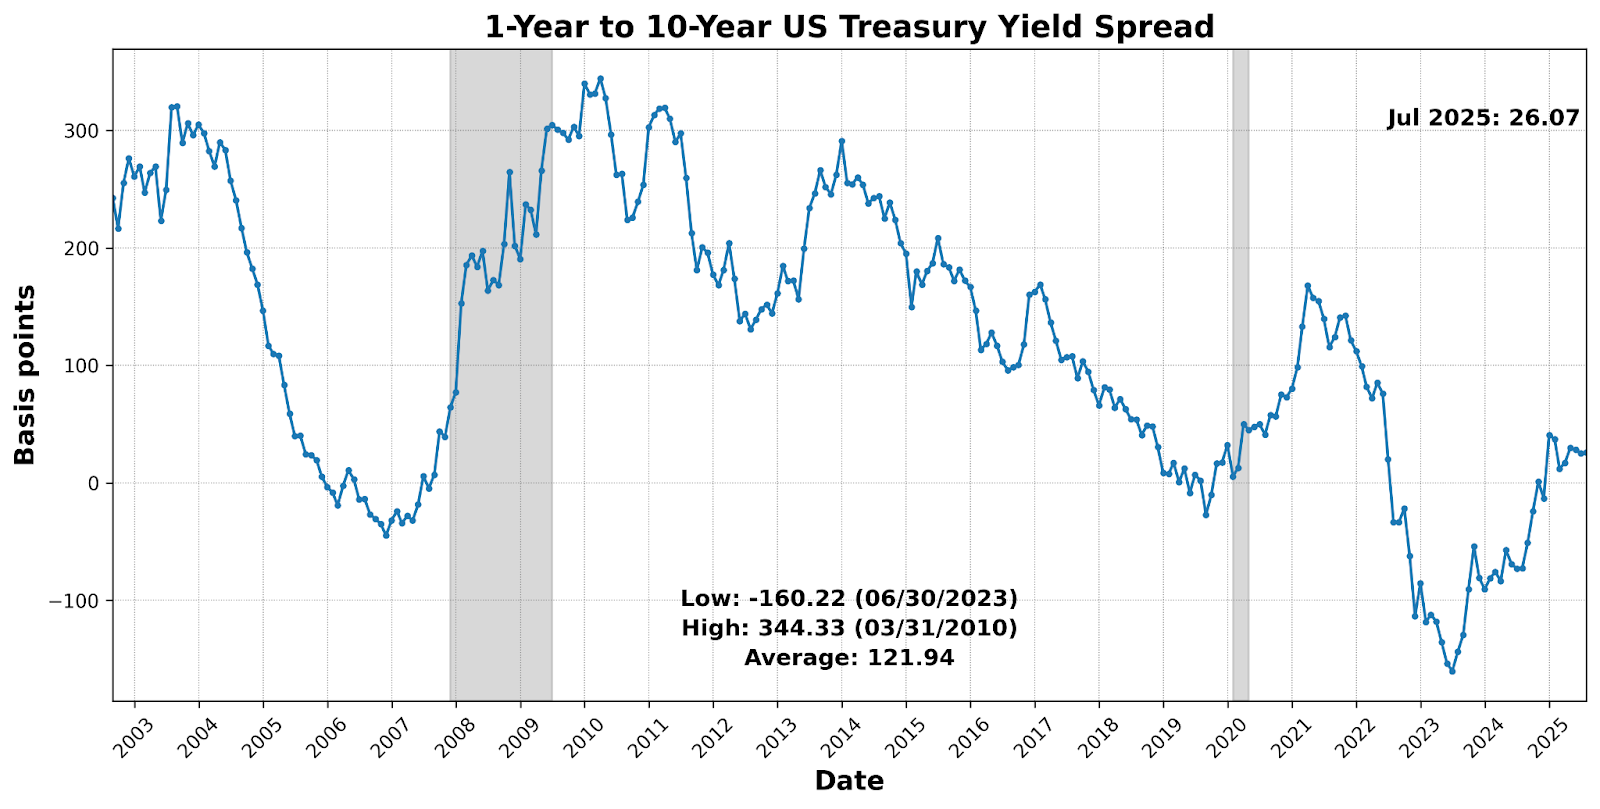
Strength was anchored by financial and market gauges: the Conference Board US Leading Index Stock Prices 500 Common Stocks surged 4.4 percent, the 1-Year to 10-Year US Treasury Yield Spread widened by 4.1 percent, and Debit Balances in Customers’ Securities Margin Accounts rose 1.5 percent. Cyclical housing activity also added support with US New Privately Owned Housing Units Started by Structure Total SAAR up 3.4 percent, while labor-market forward tone improved as US Initial Jobless Claims SA fell 5.6 percent. Smaller gains came from US Manufacturers New Orders Nondefense Capital Goods Ex Aircraft (0.8 percent), Adjusted Retail and Food Services Sales Total SA (0.6 percent), and US Average Weekly Hours All Employees Manufacturing SA (0.3 percent). Offsetting influences included a weaker Inventory to Sales Ratio Total Business (-0.7 percent), softer sentiment in the University of Michigan Consumer Expectations Index (-0.7 percent), a decline in United States Heavy Truck Sales SAAR (-0.2 percent), and only a fractional uptick in the Conference Board US Leading Index Manufacturers’ New Orders Consumer Goods and Materials (0.1 percent). The breadth picture shows continued strength in markets, claims, and housing, though tempered by softer consumer mood and transport demand.
ROUGHLY COINCIDENT INDICATOR (50)
The Roughly Coincident Indicator rose to 50 from 21 with constituents evenly balanced; three improving and three declining.
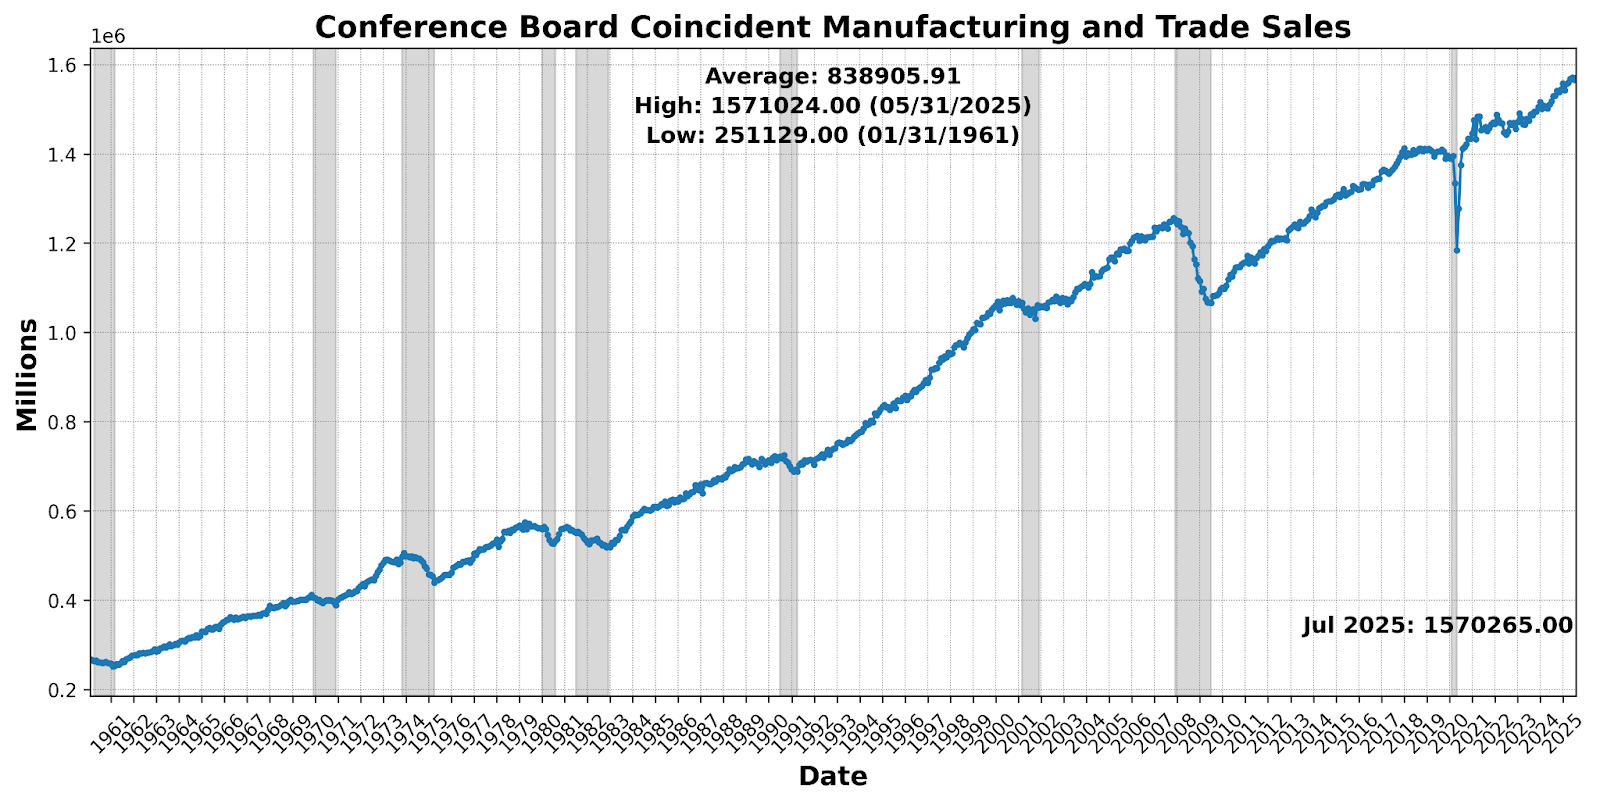
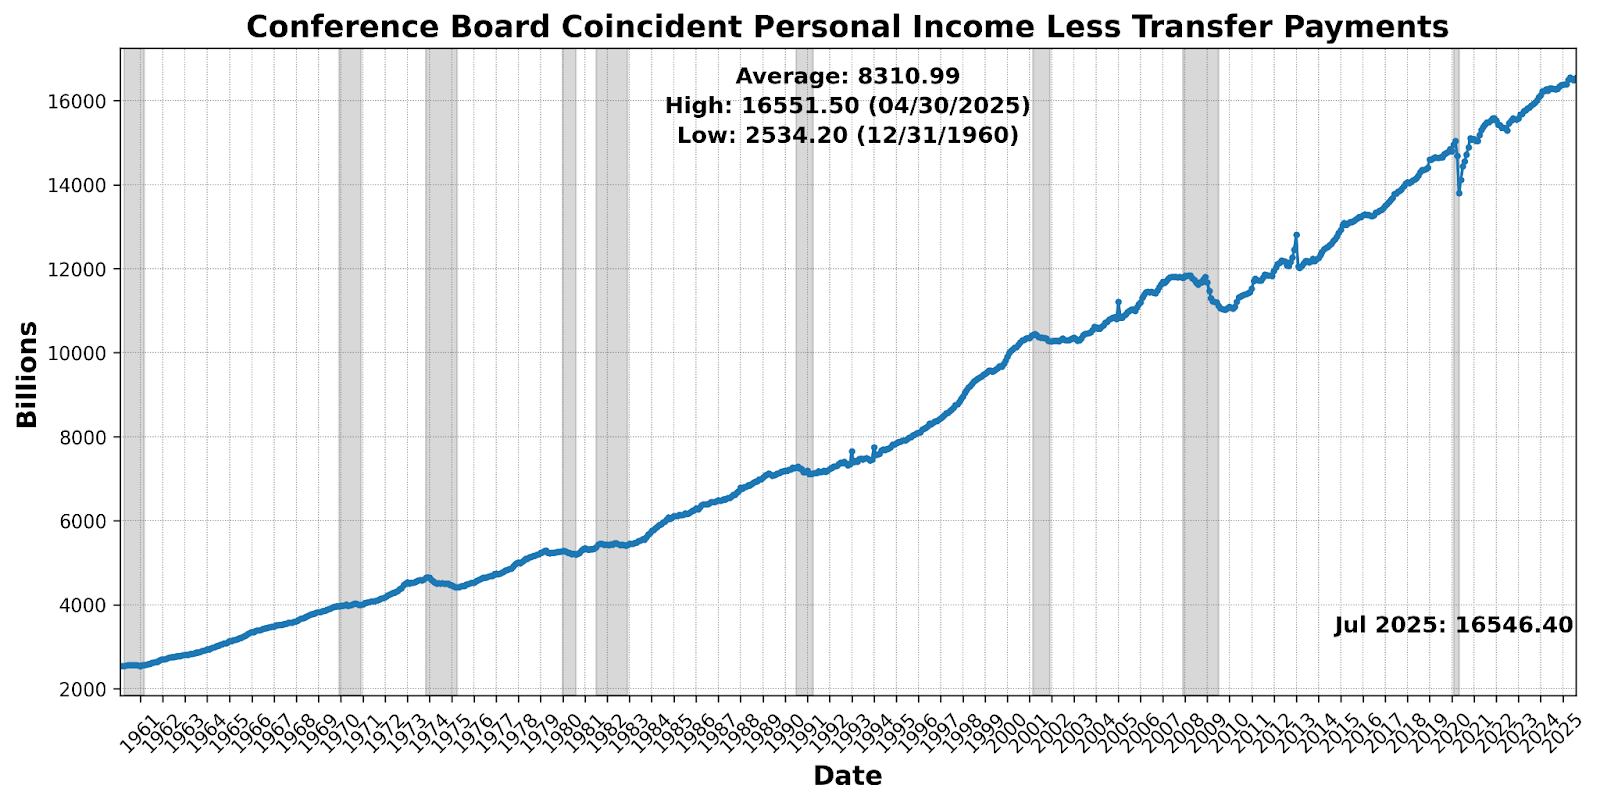
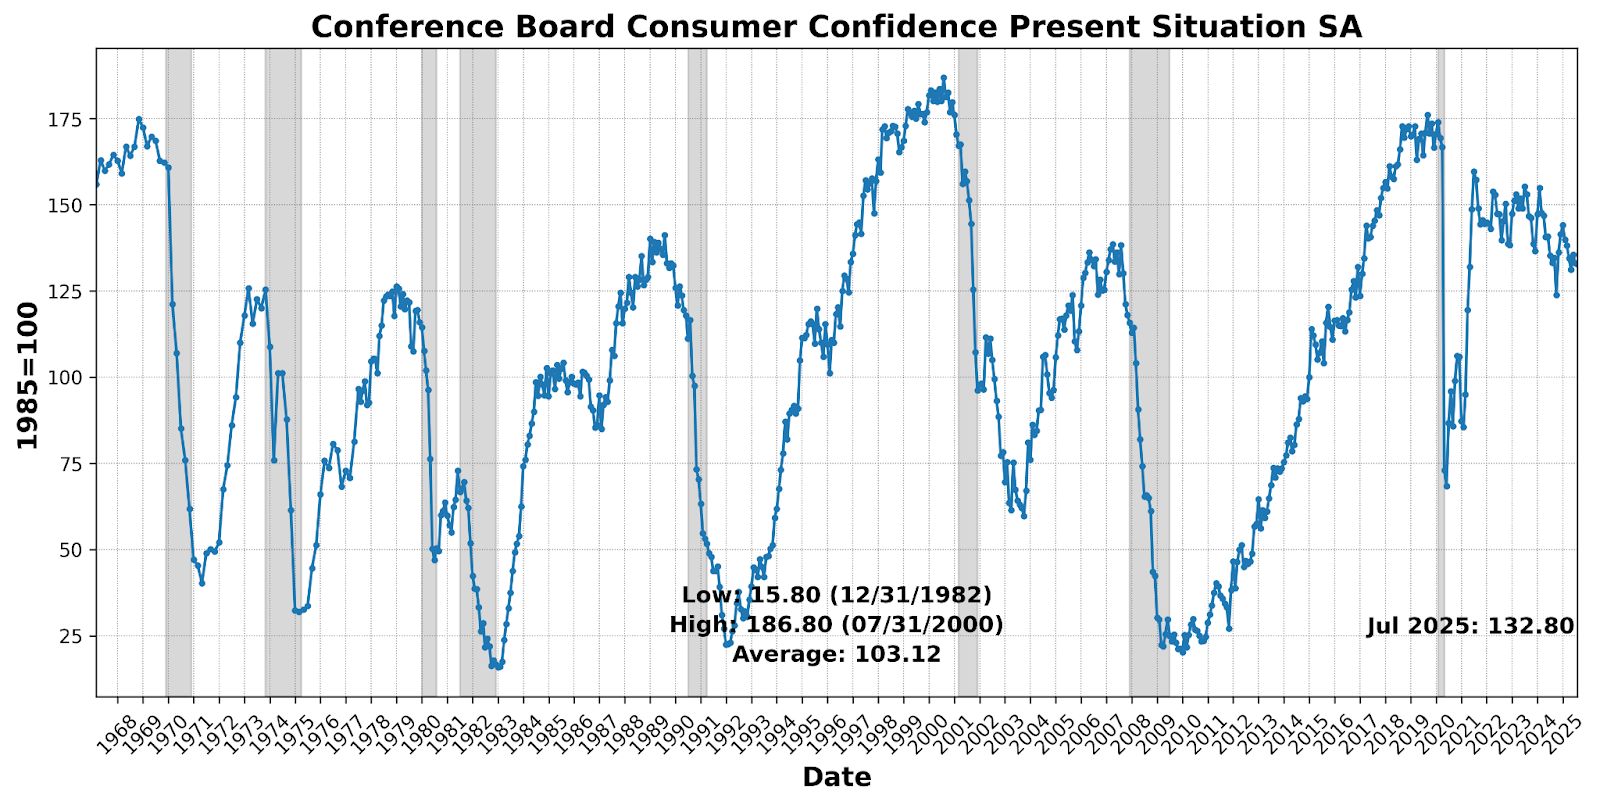
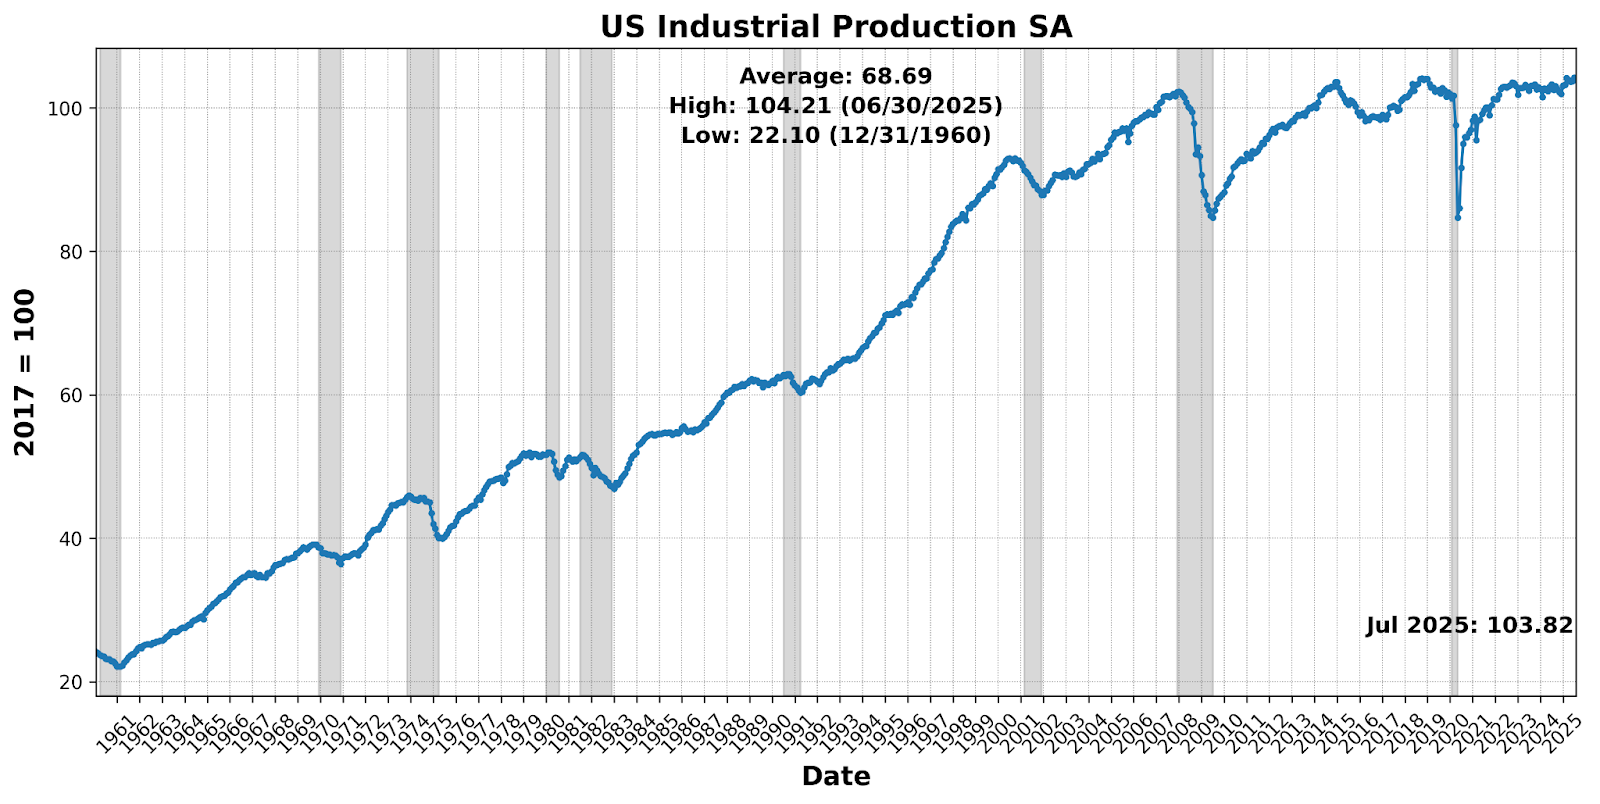
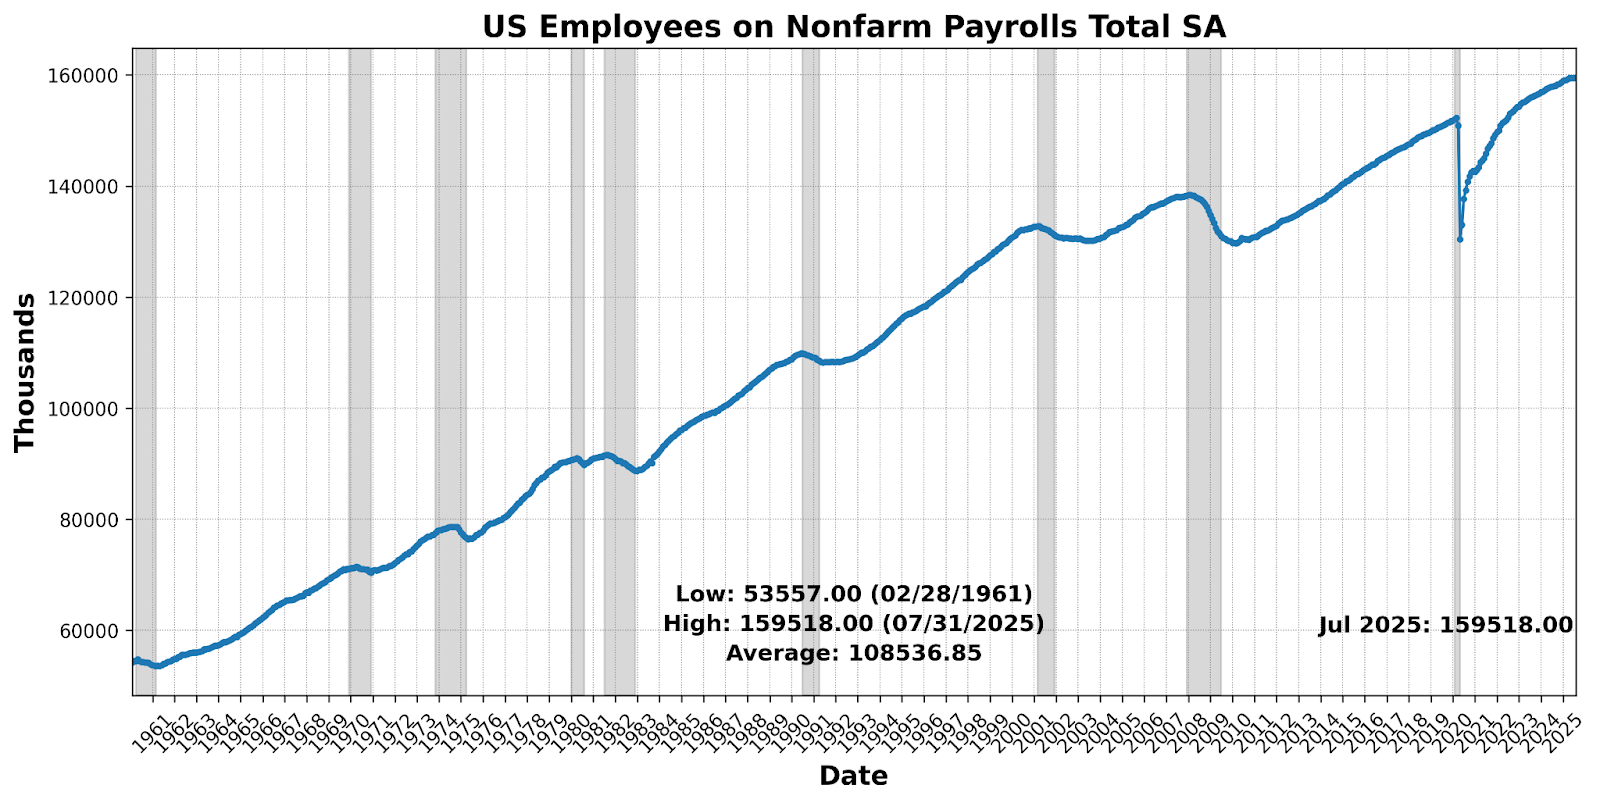
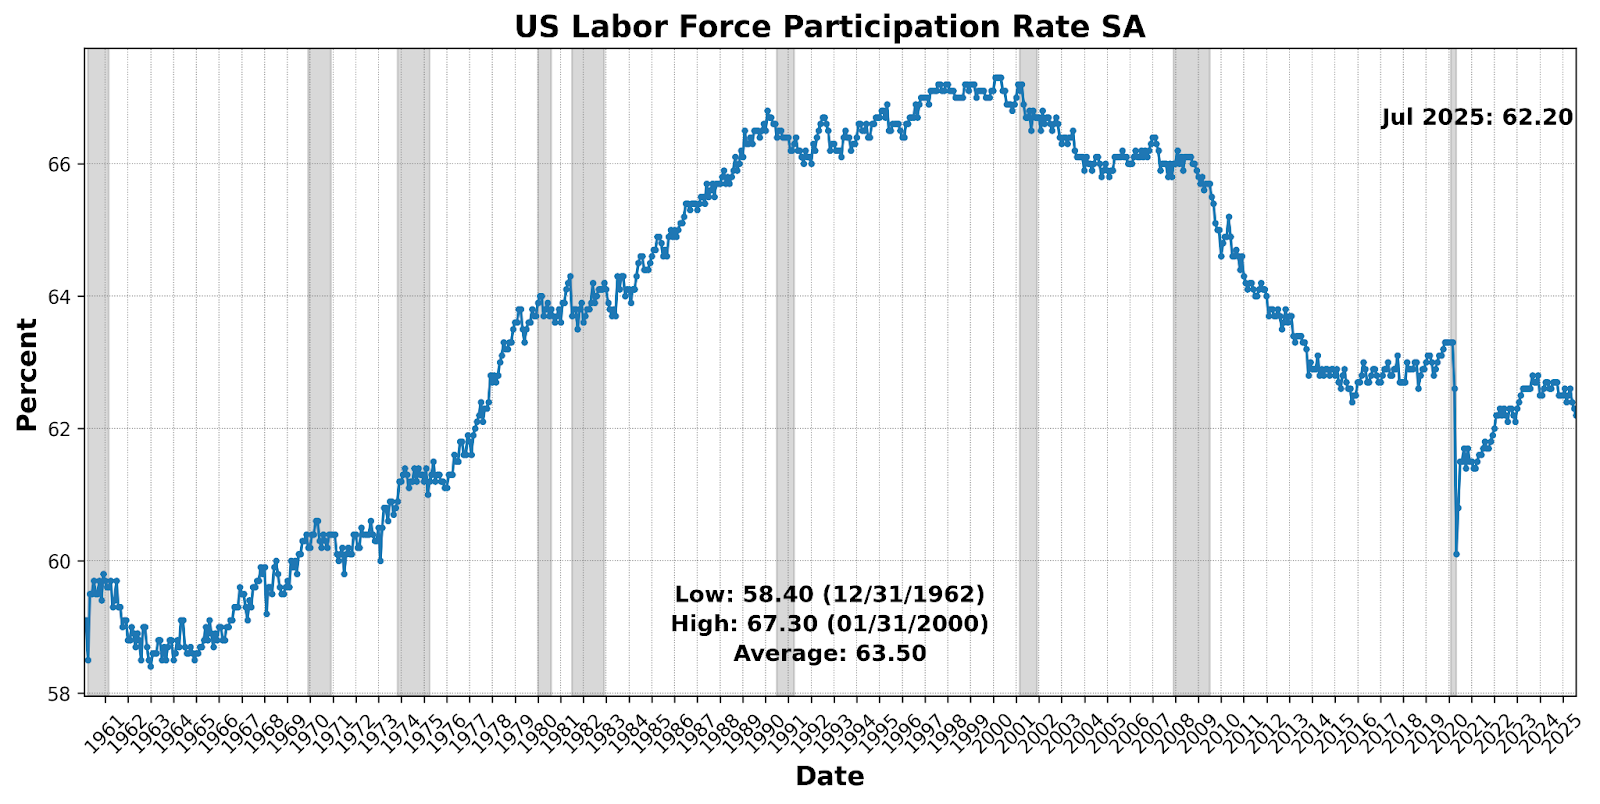
On the upside, US Manufacturing and Trade Sales and Personal Income Less Transfer Payments each rose 0.3 percent, while Nonfarm Payrolls edged 0.1 percent higher. On the downside, US Industrial Production slipped 0.4 percent, while both the Labor Force Participation Rate and the Conference Board Consumer Confidence Present Situation SA fell 0.2 percent. The overall profile suggests that modest advances in sales, income, and payrolls are being countered by weaker production, participation, and sentiment, leaving current conditions flat on net.
LAGGING INDICATOR (50)
The Lagging Indicator rose from a contractionary 25 in June to a neutral 50 in July, with three components advancing and three retreating.
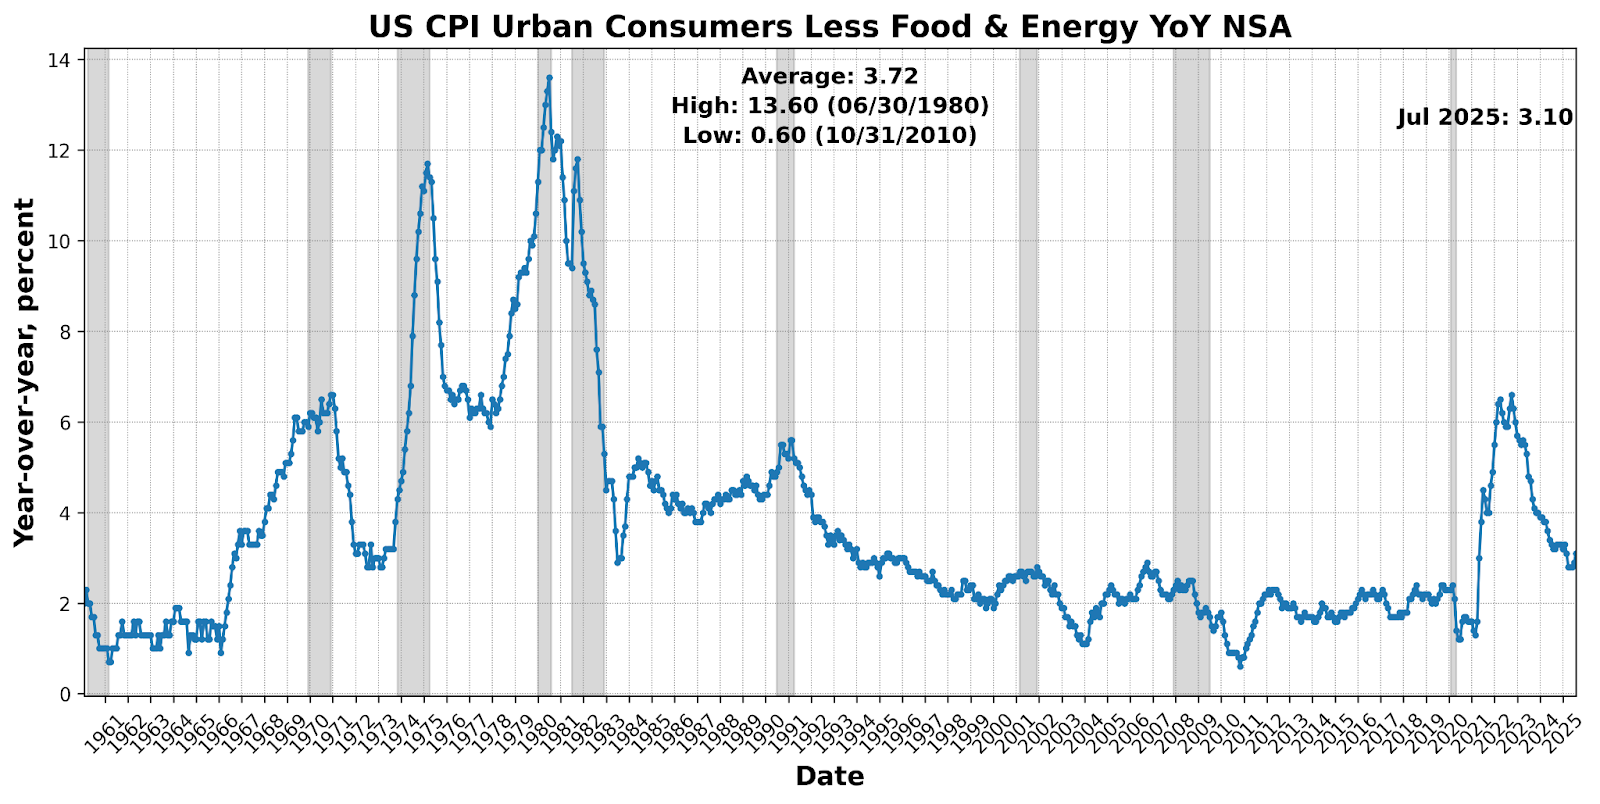
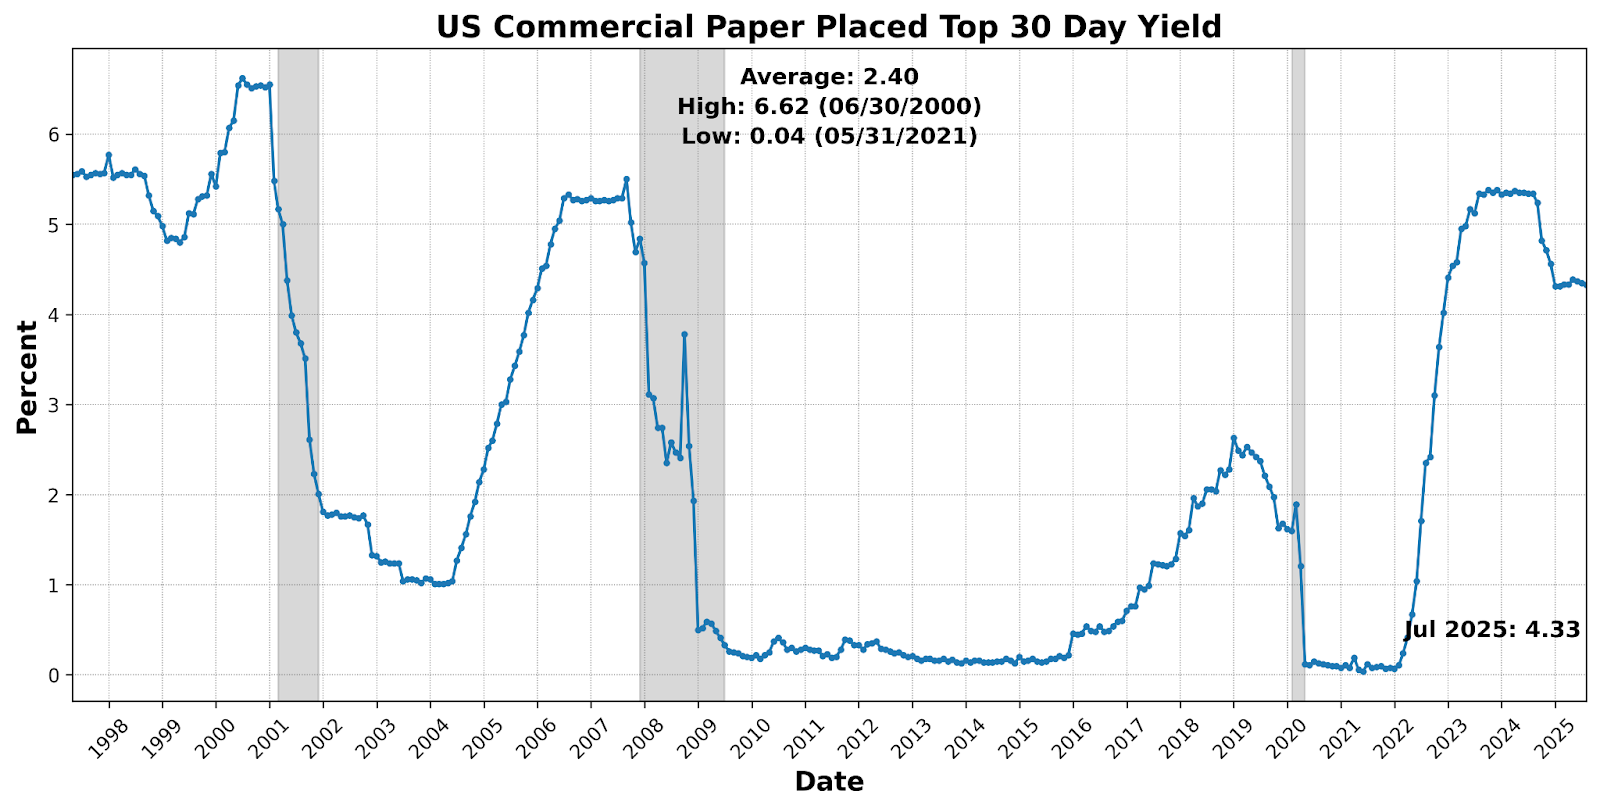
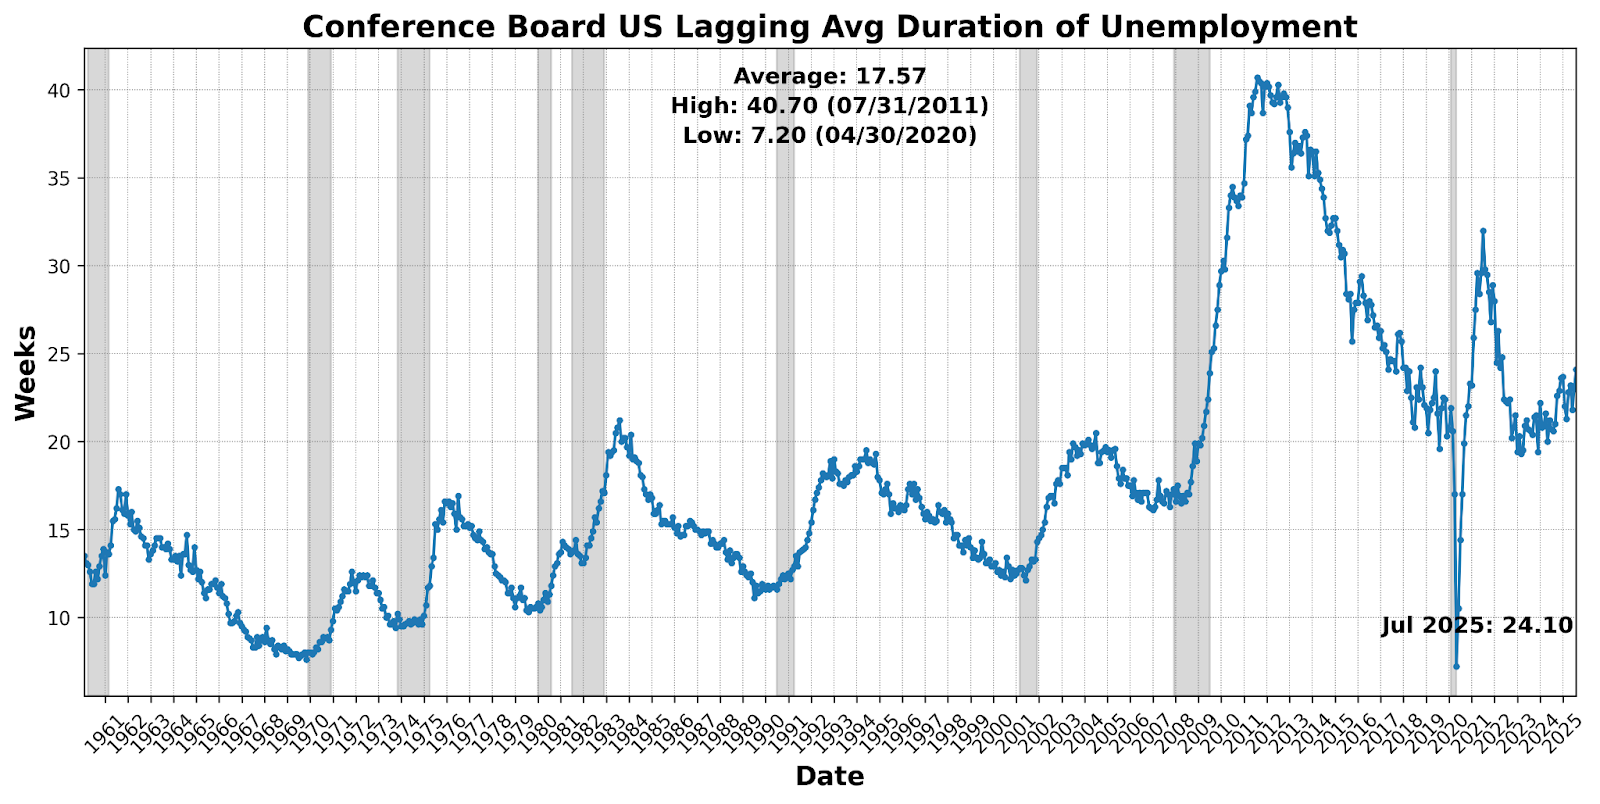
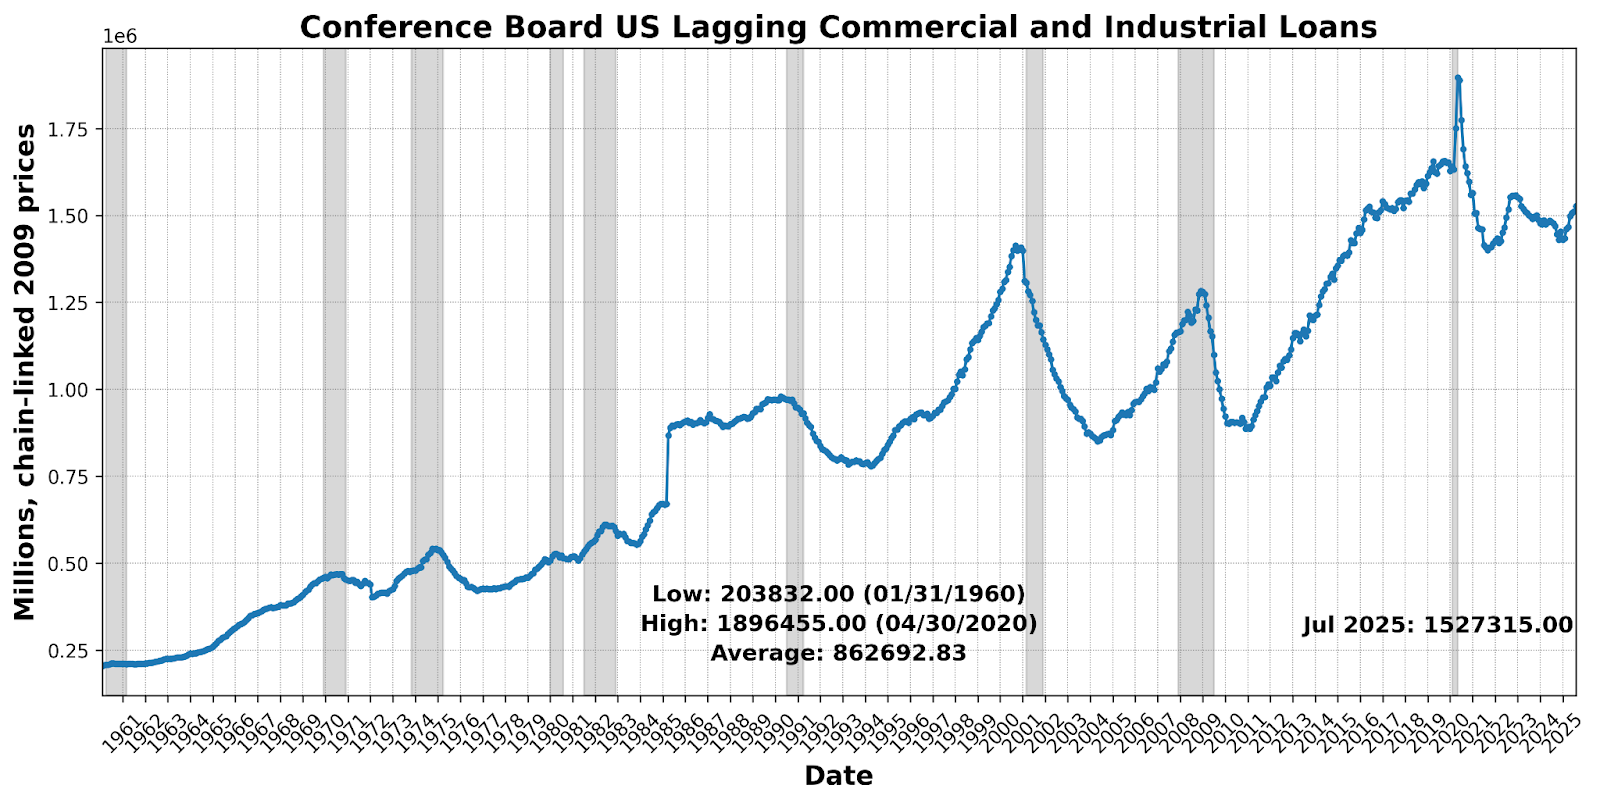
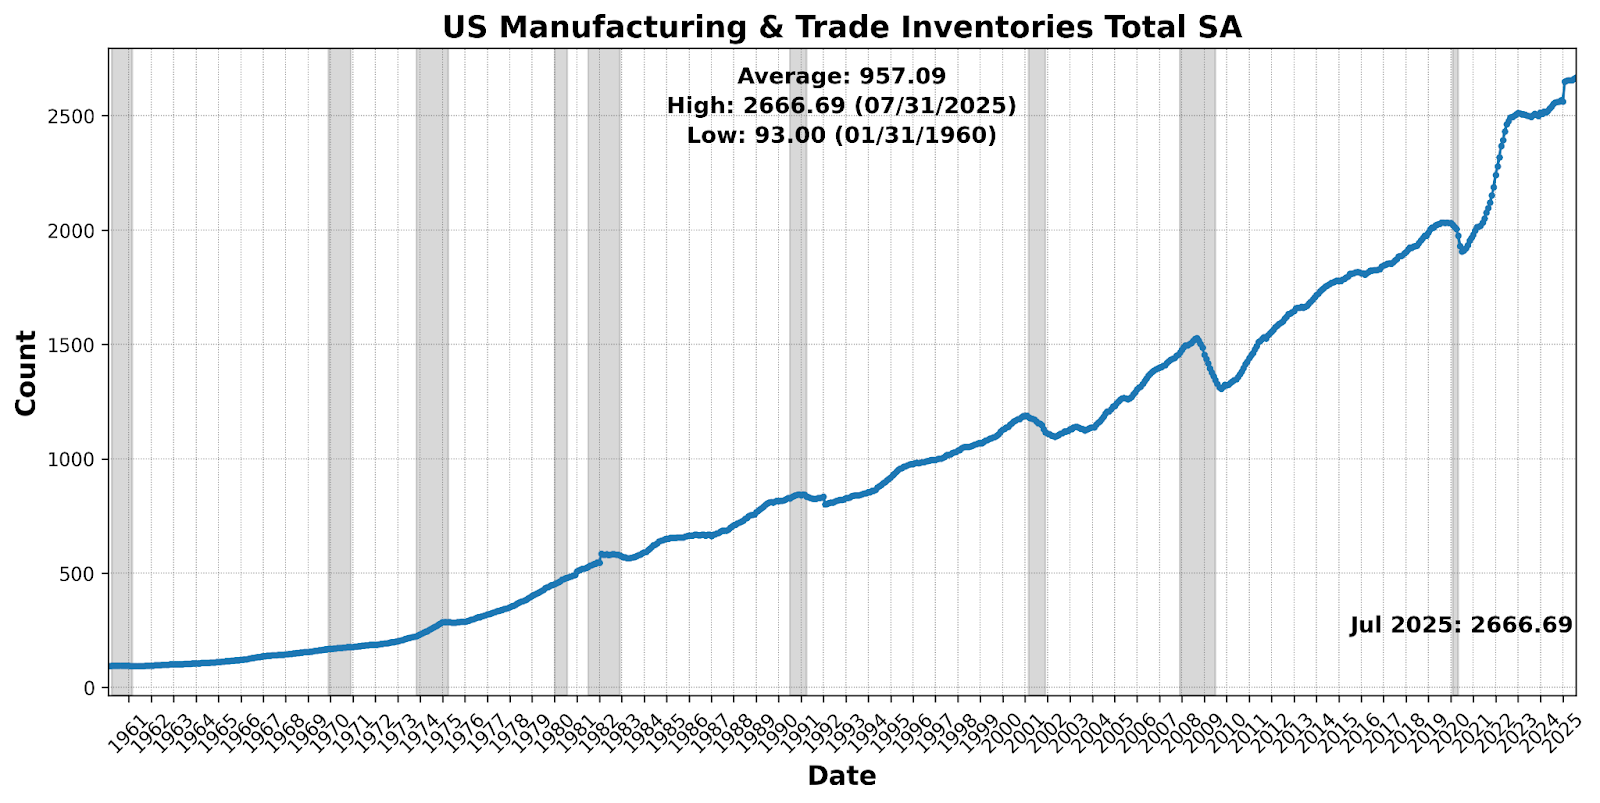
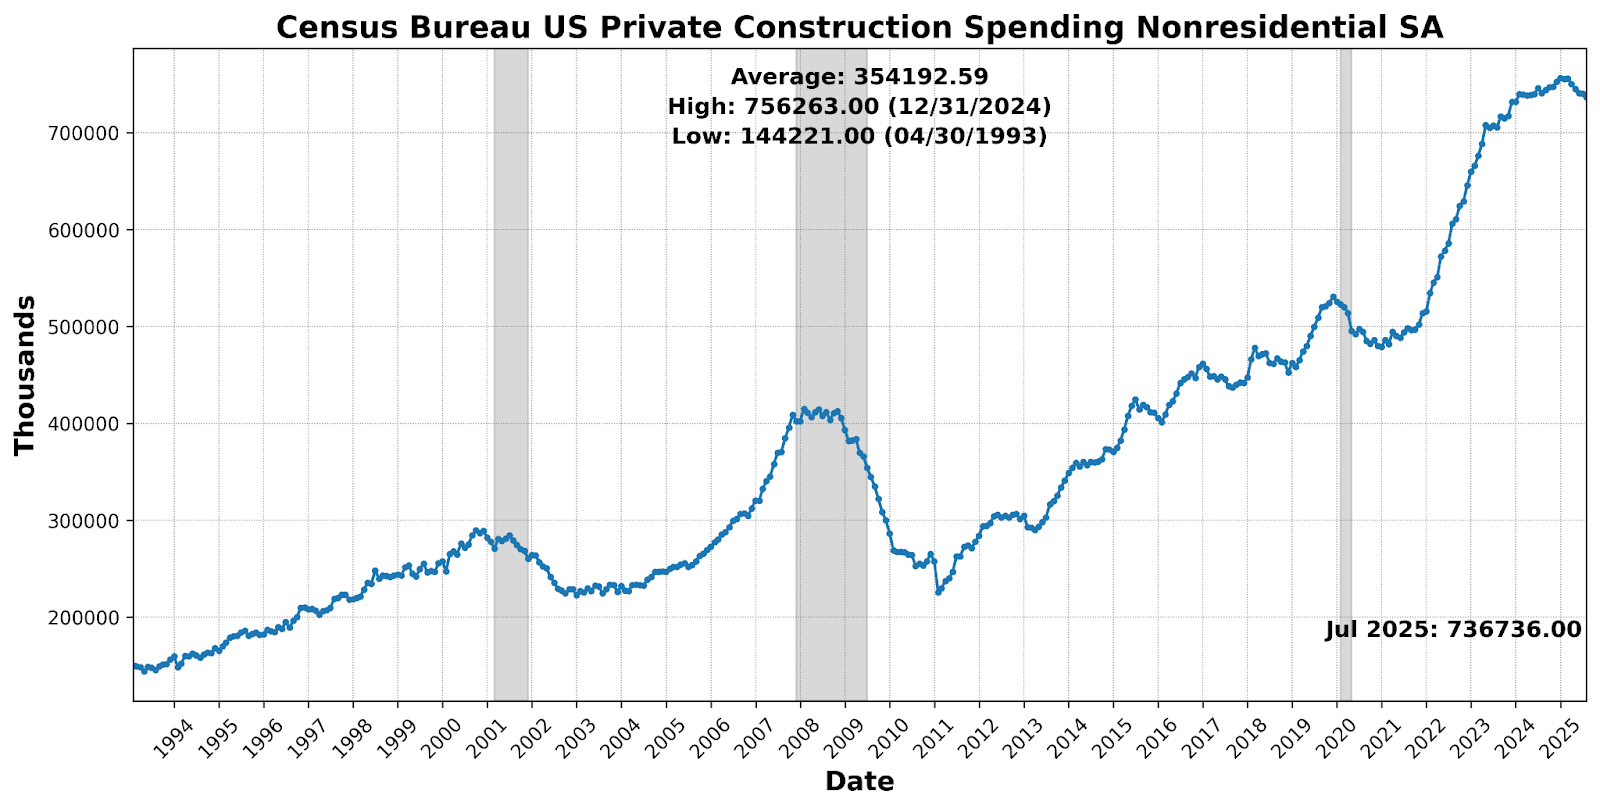
Price pressure remained the dominant driver, as US CPI Urban Consumers Less Food and Energy Year over Year NSA jumped 6.9 percent. Other positives included a 1.1 percent increase in Commercial and Industrial Loans and a 0.2 percent rise in US Manufacturing and Trade Inventories Total SA. The Conference Board US Lagging Average Duration of Unemployment (up 4.8 percent) rose, and there were declines in both Census Bureau US Private Construction Spending Nonresidential SA (-0.5 percent) and US Commercial Paper Placed Top 30 Day Yield (-0.5 percent). Taken together, the lagging profile points to strong inflation and firm loan growth offset by softer short-term rates and weakening nonresidential construction.
In July 2025, the three Business Conditions indicators are at a very different balance than they were one year prior. The Leading Index eased slightly but remains close to its strongest levels in well over twelve months. Markets and credit conditions continue to provide support, housing activity firmed, and jobless claims remained relatively low, suggesting some forward momentum. Still, the consumer mood is subdued and freight demand is soft, reflecting lingering caution after the “Liberation Day” tariff shock in April. The result is a forward picture that looks sturdier than it felt in the spring, but with confidence still tenuous.
The Roughly Coincident Index has settled toward neutral after mild strength early in the year, with payrolls and incomes showing modest gains even as production and participation have weakened. The Lagging Index, meanwhile, has swung back toward neutral levels, driven by rising prices and expanding loans but simultaneously showing longer spells of joblessness. The unusual combination — leaders holding firm with coincident and lagging indicators rising to neutral levels — suggests an economy caught between early signs of recovery and the impact of record levels of uncertainty hanging over the economy. Short- to medium-term developments will hinge on whether forward momentum broadens into real activity, and whether the renewed pressure from prices and uncertainty over trade policy continues to exert drag on growth.
DISCUSSION, August – September 2025
Inflation data for August underscored a complex picture of persistent price pressures. The headline Consumer Price Index (CPI) rose 0.38 percent while core CPI increased 0.35 percent, the fastest monthly pace since January, lifting the annual headline rate to 2.9 percent and leaving core at 3.1 percent. Importantly, the acceleration was not tariff-driven — pass-through from trade levies into consumer goods prices has diminished sharply — but was concentrated in services such as airfares and hotels, buoyed by easier financial conditions, alongside firmer food and gasoline costs. By contrast, many tariff-sensitive goods including appliances, furniture, and electronics registered outright price declines, suggesting earlier markups have peaked and margins are being absorbed by producers. Even so, the breadth of price gains remained concerning, with nearly half of CPI components running at a 4 percent annualized pace or higher, highlighting that underlying momentum has yet to break. At the wholesale level, the producer price index unexpectedly fell 0.1 percent, the first decline in four months, as service margins contracted, underscoring the difficulty firms face in passing rising costs onto households. That tension — between firm consumer-facing inflation and weak wholesale pricing — complicates the Fed’s task as it weighs both inflation persistence and demand-side fragility.
At the wholesale level, the Producer Price Index (PPI) unexpectedly fell 0.1 percent last month, the first monthly decline in four months, with July also revised lower. On a year-over-year basis, PPI rose 2.6 percent, but the details showed firms were reluctant to raise prices aggressively despite higher tariff-related costs. Services margins contracted 1.7 percent — the sharpest drop since 2009 — offsetting modest gains in goods prices, while machinery and vehicle wholesaling saw especially steep margin declines. Analysts suggest retailers have been “eating” tariff costs to avoid alienating consumers already squeezed by affordability pressures, a strategy that may not be sustainable if demand weakens further. This divergence — sticky consumer-facing CPI inflation alongside softening wholesale margins — underscores the strain facing producers and complicates the Fed’s assessment as it balances inflation persistence against signs of weaker demand.
The most recent Personal Consumption Expenditure index data reinforced that narrative: goods inflation softened while services, particularly financial and portfolio-management fees, continued to apply upward pressure. Core PCE edged modestly higher, keeping the year-over-year pace at 2.9 percent but with the three-month annualized rate rising, reflecting ongoing stickiness. Goods tied to tariffs saw softer or declining prices, while categories like recreational goods and vehicles benefitted from promotions that drove consumer activity. Personal outlays rose 0.5 percent, with real spending up 0.3 percent, though much of this strength reflected bargain-driven purchases rather than broad-based demand. Wage growth remained steady but slowed incrementally, reinforcing the impression that income support is softening. Taken together, the data suggest that services inflation remains entrenched, even as tariff pass-through fades, leaving Jerome Powell’s Jackson Hole caution — that tariff effects will accumulate over time — still relevant.
Labor market readings show clear signs of deceleration, albeit with statistical noise clouding the signal. August nonfarm payrolls rose just 22,000 following downward revisions that pushed June into negative territory, while the unemployment rate rose to 4.3 percent. Losses were broad across higher-skill sectors such as finance, professional services, and information, with gains concentrated in lower-wage areas including leisure, hospitality, and retail. Health care continued to expand but at its slowest pace since early 2022, underlining its outsized role in sustaining headline job growth. Compensation growth has moderated as hours worked were revised down, and aggregate labor income softened. While some weakness may be attributable to seasonal adjustment quirks common in August, the combination of weaker hiring, rising unemployment inflows, and slower income growth signals that labor demand is easing more quickly than supply.
Additional cooling is evident in July’s JOLTS and August ADP data. Job openings fell to 7.18 million, pushing the ratio of vacancies to unemployed workers below 1.0 for the first time in years, while quits held steady but are likely to trend lower as job-switching opportunities diminish. Health care job openings dropped to a four-year low, and ADP data showed education and health services employment contracting for a fifth consecutive month — diverging from the slower but still positive growth reported by BLS. Analysts increasingly expect reality lies somewhere in between: hospitals and nursing facilities are still hiring, but specialized services such as dentistry and outpatient care are shedding jobs. Staffing firms report shortages of licensed professionals remain a constraint, suggesting that even as demand cools, structural bottlenecks persist. Broadly, the labor market is no longer overheating but is now navigating a fragile equilibrium between weakening demand and supply-side frictions.
For households, this cooling labor backdrop collides with affordability headwinds, compounding pessimism. The prime-age employment-to-population ratio peaked a year ago, hiring rates have slowed since late 2023, and survey data show one in five Americans now view jobs as “hard to get.” For the first time since 2021, the number of unemployed has exceeded job openings, raising the risk that firms will feel less constrained in cutting staff. Unlike prior downturns in the 2000s and 2010s, this slowdown is occurring amid high inflation, elevated interest rates, and poor housing affordability, diminishing the ability of job growth to spur a broader recovery. Housing markets are showing tentative signs of normalization as inventories rise and prices soften in certain regions, but high borrowing costs continue to choke affordability. Overlaying this is heightened uncertainty about AI: unprecedented investment could either displace high-skill workers or, if misallocated, produce a sharp bust. Together, these factors help explain why even modest labor-market weakness feels more destabilizing to households than in past cycles.
Survey data reinforce this fragile balance. The ISM manufacturing PMI ticked up to 48.7 in August, still in contraction but supported by stronger new orders and a slower pace of job losses. Supplier deliveries slowed, suggesting tighter supply chains, and price pressures eased modestly, but production slipped and backlogs shrank, leaving output highly sensitive to monthly demand. Services fared better, with the PMI rising to 52.0 as new orders accelerated to their strongest pace in nearly a year, supported by demand from data centers and tariff front-running. Yet, respondents reported mounting input-cost pressures and difficulty shielding customers from higher prices, while employment remained in contraction and backlogs shrank further. In short, manufacturing remains mired in weakness while services provide a modest cushion, though both are under stress from tariffs, labor strains, and rising costs.
Confidence measures highlight the divergence between households and firms. The Conference Board’s consumer confidence index slipped to 97.4, as inflation expectations rose, views on job availability weakened, and discretionary spending intentions fell. By contrast, the NFIB small business optimism index rose to 100.8, its highest since January, with sales expectations improving and most owners rating business conditions positively. While price pressures moderated, capital spending plans and hiring intentions softened, and uncertainty remained elevated, reflecting ongoing caution. Together, the picture is one of wary consumers reining in demand and small businesses finding selective resilience but remaining reluctant to expand aggressively.
Hard data provided modest counterpoints. Retail sales surprised to the upside, rising 0.6 percent in August, with core sales excluding autos and gas up 0.7 percent and online sales surging 2.0 percent. Restaurant and bar sales rose 0.7 percent, supported by higher-income households, while the retail control group advanced 0.7 percent, a favorable signal for GDP. Industrial production posted a 0.1 percent gain after July’s downward revision, with manufacturing output up 0.2 percent on the back of vehicles, steel, pharmaceuticals, and textiles, even as aerospace output fell 0.6 percent. Utilities subtracted from the headline with a 2.0 percent drop, and business equipment production contracted modestly. Capacity utilization held steady at 77.4 percent, suggesting no meaningful reduction in industrial slack.
Policy backdrops further underscore the fragility. The Fed’s Beige Book reported little or no change in activity across most districts, with consumer spending flat or declining and tariffs cited widely as a source of rising input costs. Employment was largely unchanged but labor shortages persisted in some sectors, particularly construction, where fewer immigrant workers are available. On the monetary side, the effective federal funds rate — long anchored at the bottom of the Fed’s target range — could soon drift higher as reserves dwindle and Treasury’s bill issuance drains liquidity. Market participants warn that a drop toward the Fed’s “comfort floor” of $2.7 trillion in reserves could force intervention. On the fiscal side, Congress remains gridlocked, with Democrats pushing a $1.5 trillion package tied to health care subsidies and Medicaid, while Republicans press for a clean extension. The standoff adds another layer of uncertainty to an economy already facing tighter liquidity and cooling household sentiment.
Taken together, the US economy continues to straddle a narrow path between modest growth and mounting risks. Inflation is proving sticky, concentrated in services, while goods inflation has eased. Labor markets are cooling but remain structurally uneven, with health care still a critical but weakening pillar. Consumers are growing more cautious under the weight of affordability challenges, while businesses express guarded optimism tempered by investment and hiring constraints. Manufacturing is weak but services show resilience, leaving overall momentum uneven. Fiscal policy gridlock and monetary tightening through liquidity channels add to the uncertainty. As such, growth may persist into year-end, but fading momentum, sticky inflation, and policy constraints suggest an outlook of fragile stability rather than robust expansion.
LEADING INDICATORS
ROUGHLY COINCIDENT INDICATORS
LAGGING INDICATORS
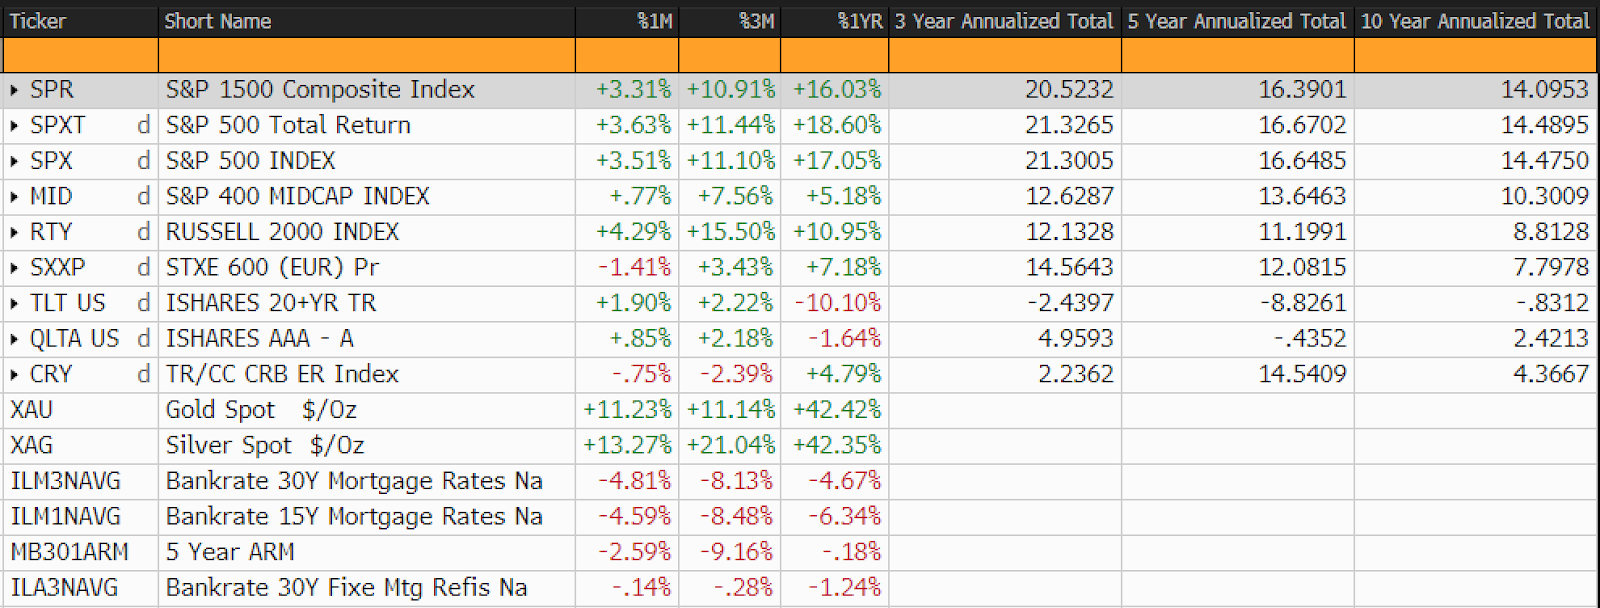
CAPITAL MARKETS PERFORMANCE